

Our newly published, peer-reviewed critique and independent reanalysis of the Henry Ford vaccinated–unvaccinated birth cohort study (Lamerato et al.) — revealed at the U.S. Senate Hearing on September 9, 2025 — shows that the original authors failed to analyze or disclose the dramatic proportional differences present in their own data.
Authored by John W. Oller, Jr., PhD; Daniel Broudy, PhD; and Nicolas Hulscher, MPH, this peer-review and reanalysis provides the first accurate proportional interpretation of the dataset.
The Lamerato et al. study of a total population of 18,468 individuals between birth and 18 years of age during the years from 2000 to 2016 — of which the 16,511 in the vaccinated cohort received a median of 18 vaccines, whereas the 1,957 in the unvaccinated cohort received none at all — probably represents the most comprehensive real-world comparison of vaccinated versus unvaccinated children ever conducted within a self-contained whole population in a full-service integrated health system in the US.
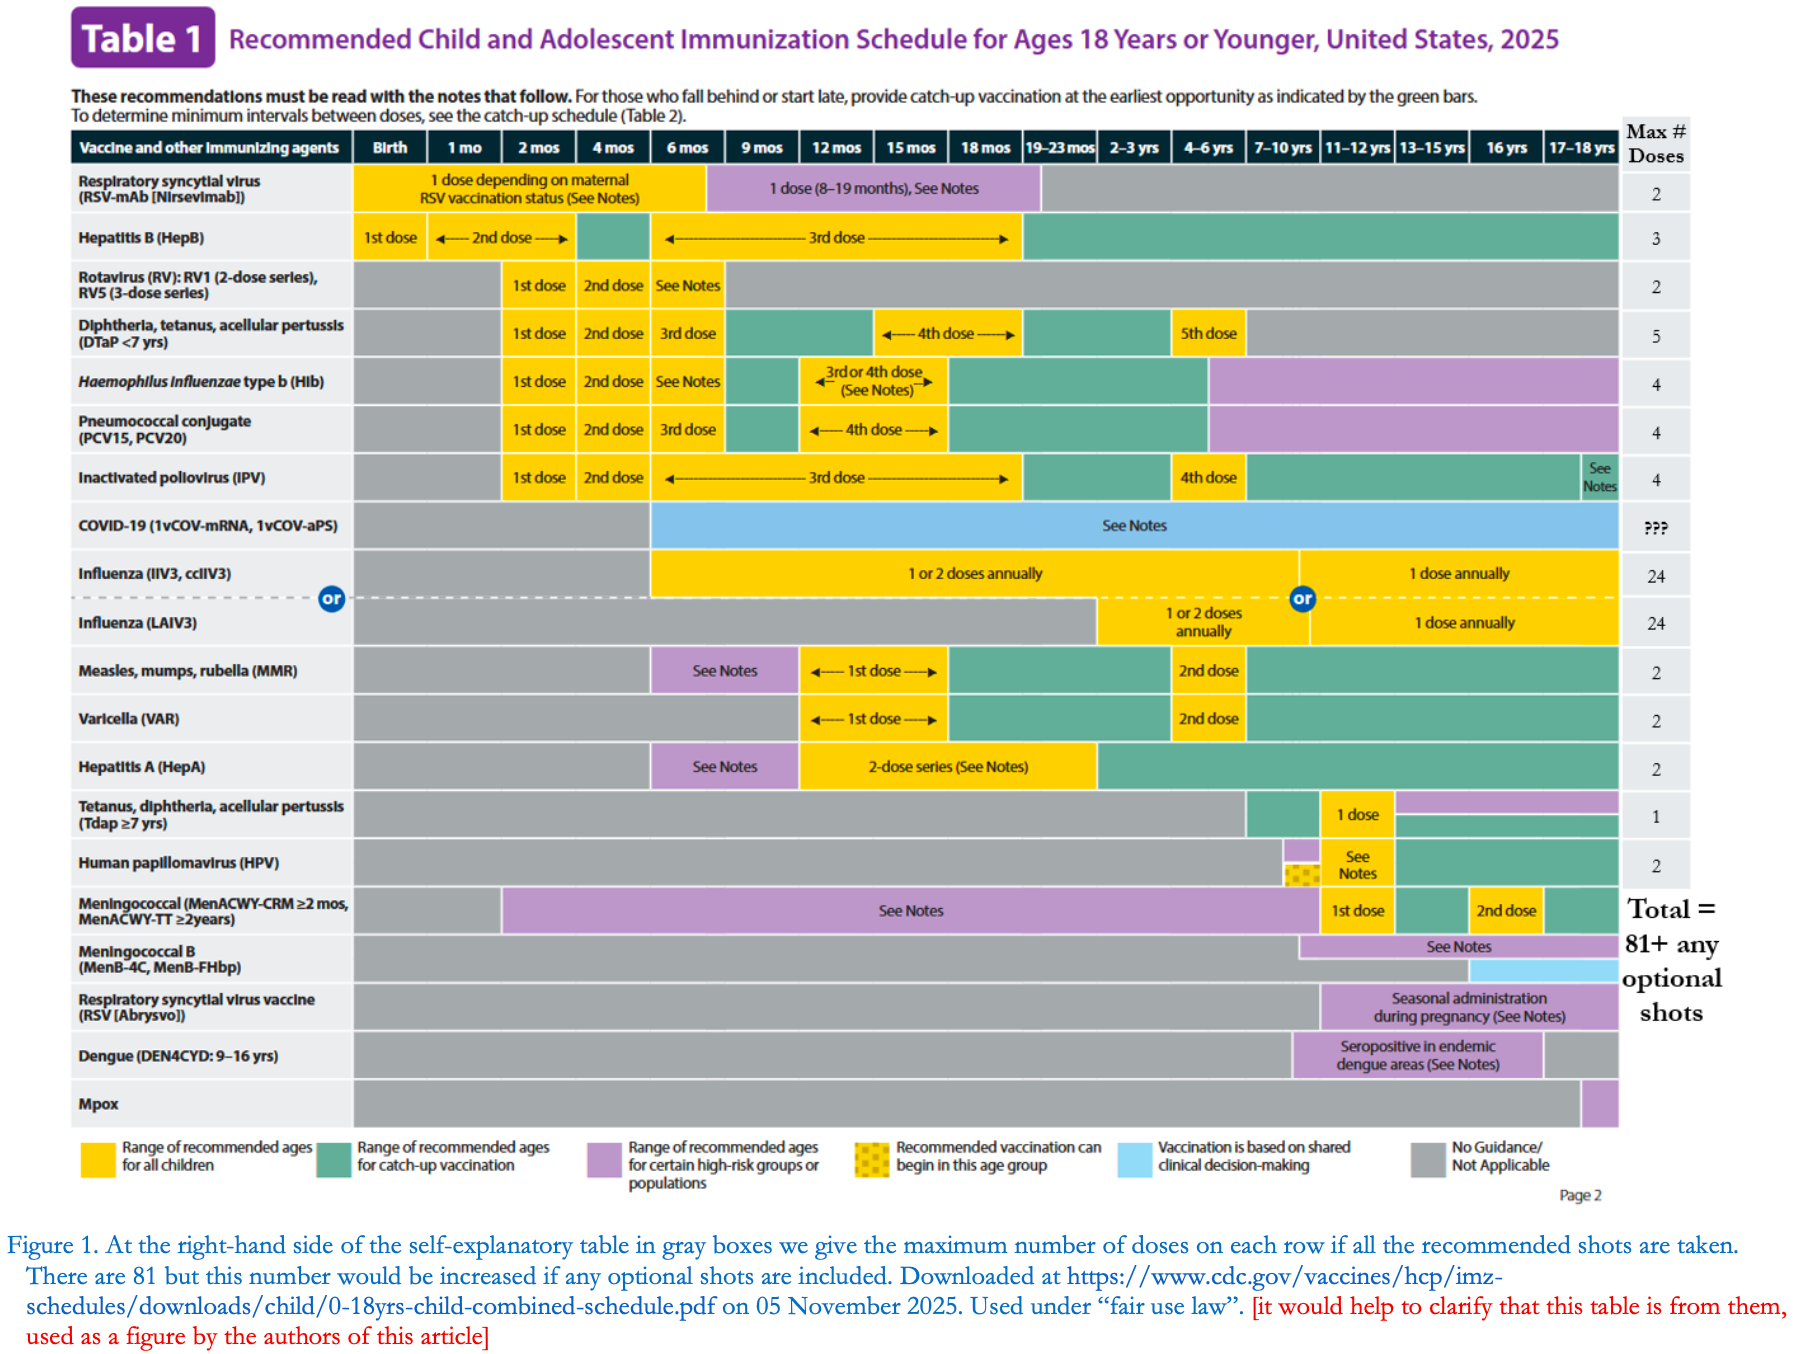
For context, we calculated that the current CDC childhood immunization schedule now contains at least 81 doses of vaccines by age 18 — more than four times higher than the median exposure in the Henry Ford cohort. This means that the dramatic disparities we uncovered in this dataset emerge even at a fraction of the full CDC schedule.
We initiated this reanalysis because the study used statistical approaches that masked large disparities, particularly in outcomes where the unvaccinated group had zero or near-zero cases.
Instead of examining actual proportional incidence, Lamerato et al. relied on odds-ratio modeling and a “strict definition” of cases that created the false appearance of equivalence. Our peer-review demonstrates that these choices systematically minimized the large, consistent contrasts present in the raw numbers — contrasts so large that the authors themselves, had they simply reported them, would have been compelled to acknowledge dramatically worse outcomes in the vaccinated cohort.
Once the data are viewed through the proper lens — proportions per cohort, the same approach the original table already implies — the picture changes entirely.
Our reanalysis shows that vaccinated children were sicker in all 22 chronic disease categories listed — a pattern reinforced by two of the most striking findings in the dataset: a 549% higher rate of autism-associated neurodevelopmental conditions and a 54% elevation in childhood cancer in the vaccinated cohort. These signals emerge only when the data are analyzed proportionally, without the statistical distortions used in the original report.
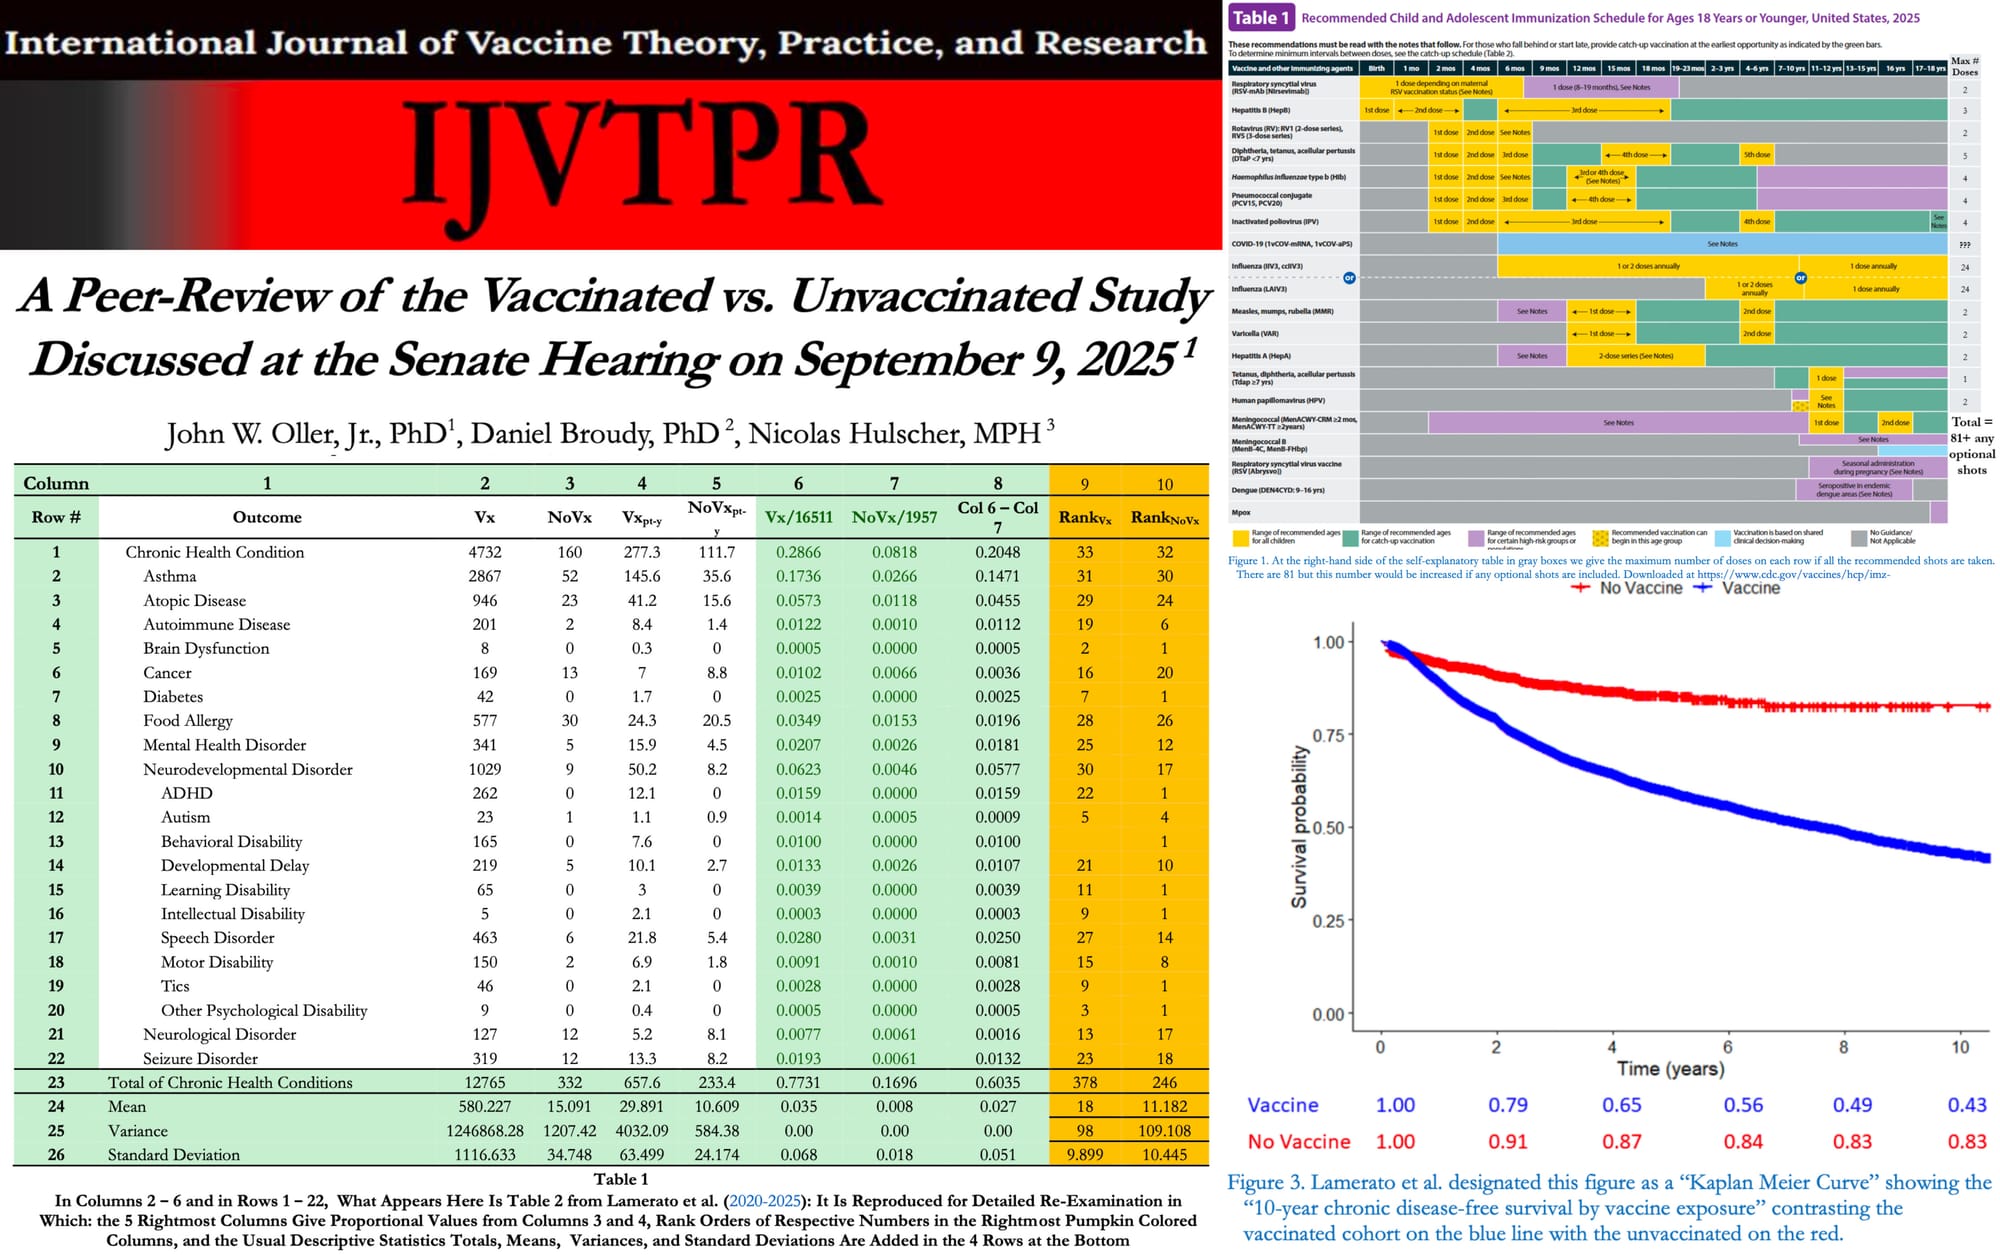
Every One of the 22 Chronic Conditions Was Higher in Vaccinated Children
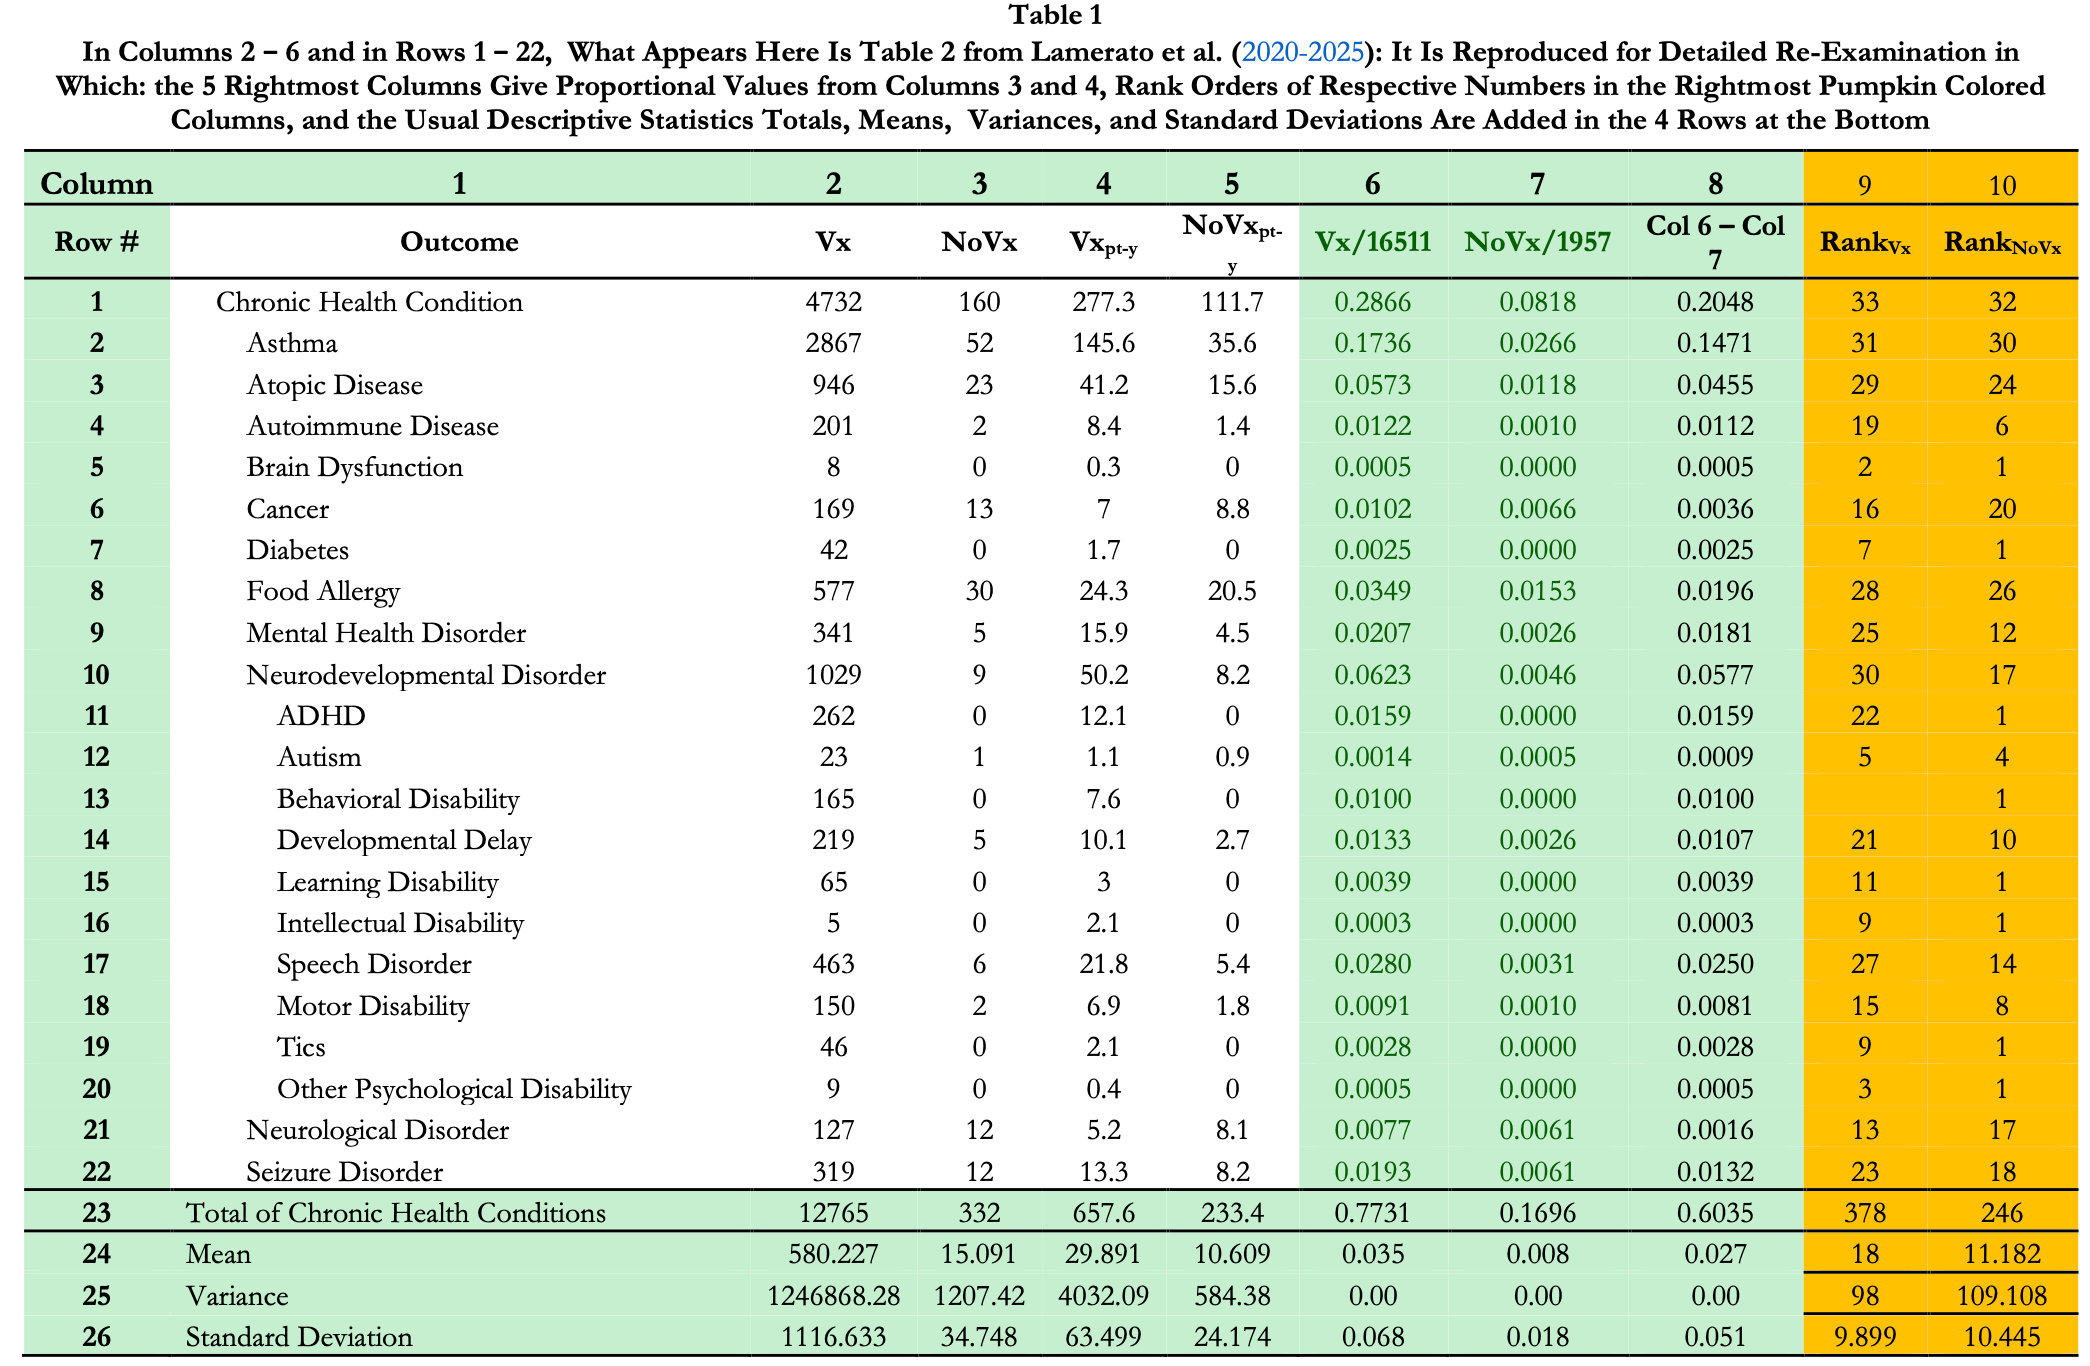
Our reanalysis of Lamerato et al. Table 2 found that all 22 chronic disease categories appeared at higher proportional rates in vaccinated children, with many conditions elevated 10× to 20×.
1. Chronic health condition (any)
0.2866 vs 0.0818 → 3.50× higher (+250%)
2. Asthma
0.1736 vs 0.0266 → 6.53× higher (+553%)
3. Atopic disease
0.0573 vs 0.0118 → 4.86× higher (+386%)
4. Autoimmune disease
0.0122 vs 0.0010 → 12.2× higher (+1,120%)
5. Brain dysfunction
0.0005 vs 0.0000 → Present only in vaccinated
6. Cancer
0.0102 vs 0.0066 → 1.54× higher (+54%)
7. Diabetes
0.0025 vs 0.0000 → Present only in vaccinated
8. Food allergy
0.0349 vs 0.0153 → 2.28× higher (+128%)
9. Mental health disorder
0.0207 vs 0.0026 → 7.96× higher (+696%)
10. Neurodevelopmental disorder (umbrella)
0.0623 vs 0.0046 → 13.54× higher (+1,254%)
11. ADHD
0.0159 vs 0.0000 → Present only in vaccinated
12. Autism
0.0014 vs 0.0005 → 2.8× higher (+180%)
13. Behavioral disability
0.0100 vs 0.0000 → Present only in vaccinated
14. Developmental delay
0.0133 vs 0.0026 → 5.12× higher (+412%)
15. Learning disability
0.0039 vs 0.0000 → Present only in vaccinated
16. Intellectual disability
0.0003 vs 0.0000 → Present only in vaccinated
17. Speech disorder
0.0280 vs 0.0031 → 9.03× higher (+803%)
18. Motor disability
0.0091 vs 0.0010 → 9.1× higher (+810%)
19. Tics
0.0028 vs 0.0000 → Present only in vaccinated
20. Other psychological disability
0.0005 vs 0.0000 → Present only in vaccinated
21. Neurological disorder
0.0077 vs 0.0061 → 1.26× higher (+26%)
22. Seizure disorder
0.0193 vs 0.0061 → 3.16× higher (+216%)
All 22 conditions were higher in vaccinated children — with increases ranging from +26% to over +1,200%, and multiple disorders appearing only in the vaccinated group.

Want to give some gifts that will be remembered for years to come and help your friends, family and colleagues better understand the scam of “Government?”
Happy Holidays from the Art of Liberty Foundation! Get 15% off until midnight PST December 16th using the discount code: Liberty15, and 10% off from December 17th until Christmas using the discount code: Liberty10!
Shop for unique books and gifts now at ArtOfLiberty.org/Store


