

I. Introduction
As the Los Angeles County Metropolitan Transportation Authority (LACMTA), or LA Metro, reaches its thirty-two-year anniversary, this investigation of the organization’s operations has found that Los Angeles is served by a dangerous and costly public transportation system. For those reasons, Independent Institute is awarding LA Metro the eighteenth California Golden Fleece© Award, a dishonor given to California’s state or local agencies or government projects that swindle taxpayers or break the public trust. This report offers key recommendations for upgrading LA Metro’s service delivery.
LA Metro’s mission is to “provide high-quality mobility options that enable people to spend less time traveling” and to “enhance communities and lives through mobility and access to opportunity.”[1] Based on those measures, the transportation system fails. LA Metro performs poorly in even the most basic areas, including safety, cleanliness, and service quality. Every transit agency must be minimally proficient in each of these areas. It is also financially reckless, allocating billions of dollars in countywide taxes to build unneeded rail lines and to mismanage its existing system. LA Metro should not be permitted to continue status quo operations. A detailed accounting of its problems demonstrates the need for fundamental reforms to the system.
For more successful approaches, Los Angeles area residents should look to transit agencies building bus-based transit systems. Both internationally and domestically, cities with urban spatial structures similar to Los Angeles, such as Washington, DC, have decided that rail network expansions do not make sense.[2] Bus Rapid Transit (BRT) networks, which are being built throughout the country and around the world, can be brought online at a fraction of the cost of light-rail. Other systems have lower labor costs, with less union influence and better employee–employer relationships, along with automated rail functions. International systems are laser-focused on customer satisfaction and more likely to outsource routine back-office operations. Competitive contracting is one tool to improve service and reduce costs.
Transit agencies act as de facto monopolies. Since they have no competition, they have no incentive to improve service. Yet, new and existing technologies including ridesharing services, shuttle buses, vanpools, ferries, and even active transportation (walking and cycling) could compete with entrenched transit operators on at least a subset of the trips. The advent of telework, more dispersed residential and employment locations, and other technological changes call into question the wisdom of capital-intensive rail-expansion plans.
II. Background
A. History of Los Angeles Transit
Los Angeles’s transit system has a long history that dates back to the 1800s.[3] In the 1870s, the city first began granting operational franchises for horse-drawn streetcars. In the 1880s, the railways evolved into cable car railways.[4] In the 1890s, the city built its first electric railway. These routes and systems were supplemented by the introduction of diesel motorbus lines in the 1920s following World War I.[5] Early forays into underground rail systems also began in 1925, with a one-mile tunnel linking the Subway Terminal Building (on South Hill Street between 4th and 5th Streets) to the foot of Glendale Boulevard, which remained in use only until 1955.[6]
The transit system in Los Angeles was largely comprised of streetcars in the early 1900s.[7] Those streetcars slowly began to vanish from LA’s streets as automobiles became more popular. Eventually, consumer demand for automobiles eroded streetcar-system ridership,[8] paving the way for a major shift in the mid-1960s to a bus-dominated transit system.
Over those formative decades, about two hundred privately owned and operated transit companies came and went. What’s now referred to as the “Great Merger of 1911” consolidated many of the existing transit companies into two main systems.[9] The first system was the Pacific Electric Railway, which had a service area covering Los Angeles, Riverside, Orange, and San Bernardino Counties. The second was the Los Angeles Railway System, which operated streetcars connecting LA’s suburbs and other nearby neighborhoods to the central business district in downtown Los Angeles.
In 1951, efforts spearheaded by the Los Angeles Chamber of Commerce, working with the California state legislature, culminated in the formation of the Los Angeles Metropolitan Transit Authority (LAMTA). LAMTA’s board comprised gubernatorial appointees, who had to be appointed in consultation with local officials. LAMTA was established with one goal in mind: to replace the existing network of privately owned and operated transit systems with a publicly owned and operated system of mass rapid transit. It was initially left, however, with no real financial means of acquiring the existing private networks.
In 1957, California’s legislature passed the LAMTA Act, which authorized LAMTA to purchase and operate existing privately owned bus and rail lines, capital for which was provided by the sale of revenue bonds.[10] Still, that limited authority was insufficient for the goals envisioned by both the legislature and public transit proponents in the Los Angeles Chamber of Commerce. Notably, LAMTA could not levy taxes as a means of raising revenue to pay for the services it was going to offer; nor could it acquire any property by exercising the powers of eminent domain.
Therefore, a successor organization was created in 1964—the Southern California Rapid Transit District (SCRTD).[11] Among other authorities, the SCRTD could acquire property by eminent domain, levy taxes (with voter approval), issue bonds, and create Benefit Assessment Districts (geographical areas defined for a property tax that will benefit from a public service, like transit) as a means of sustaining itself.[12] The main goal of the SCRTD was to develop heavy-rail transit for the Los Angeles area.
Rapid expansion and acquisition followed. SCRTD acquired an array of transit assets under its renewed mandate and expanded authority, including:
Pasadena City Lines
Inglewood City Lines
Blue and White Bus Company
Eastern Cities Transit
San Pedro Transit Lines
Highland Transit
Ontario-Upland Bus Lines
La Rambla Bus Lines
Pomona Valley Municipal Transit System
Western Greyhound Lines
Despite these acquisitions, SCRTD was unable to sustain rail transit. This shortcoming led to the 1976 passage of Assembly Bill (AB) 1246 to create the Los Angeles County Transportation Commission (LACTC).[13]
This was followed by a voter-approved tax that was implemented in 1980.[14] Proposition A imposed a half-cent sales tax increase and was approved by vote.[15] (Note that the authority to place an issue on the ballot was transferred from SCRTD to LACTC by the LACTC founding legislation.) Proposition A also included a provision for a $0.50 bus fare, sunsetting three years after passage.[16] The impact of this $0.50 bus fare was dramatic. Fares before the proposition went into effect were $0.85, making the $0.50 fare a 41 percent reduction. The $0.85 fare returned after the consent decree sunsetted three years later.[17] The $0.50 fare, however, led to a nearly 40 percent bus ridership increase, maybe the largest transit ridership increase in history, especially in the post–World War II era.[18]
When the fare reduction ended, funds were reallocated to different targets: “25 percent for the cities, a minimum of 35 percent for transit guideway development (Metro Rail and light rail projects), and the balance of 40 percent for discretionary public transit improvements as defined by LACTC.”[19]
Since then, despite nearly 20 percent growth in the population of the Los Angeles metropolitan area, ridership still remains below the mid-1980s peak.[20]
Some administrative overlap still existed between the SCRTD and the LACTC. The two agencies began to work against each other as competitors, especially when the two started to develop rail projects.[21] The SCRTD focused on heavy-rail, and LACTC focused on light-rail. Friction worsened between the two agencies as responsibility for the Metro Rail construction project was shifted from the SCRTD to the LACTC in 1988.
AB 152, passed in California’s 1992 regular legislative session, merged the SCRTD and the LACTC into the Los Angeles County Metropolitan Transportation Authority (LA Metro), which is still the major public transit provider and operator in the metro area today.[22]
B. The Role of Transit in an Automobile-Dominated City
Since the widespread introduction of the automobile, Los Angeles has become an auto-centric city. The discontinuation of streetcars, detailed in the previous section, was a major landmark in LA’s transformation into a car-based city. The city’s transit system had become famous for its streetcars, but the growing use of automobiles and the use of single-family zoning made the benefits of streetcar transit less pronounced.
Automobiles democratized mobility. Instead of relying on a transit system like a streetcar or a fixed-route service, drivers could leave their houses and head directly to their destinations. Wider market access brought greater affordability as the automobile industry scaled up in the United States, making the option more accessible to everyday Americans.
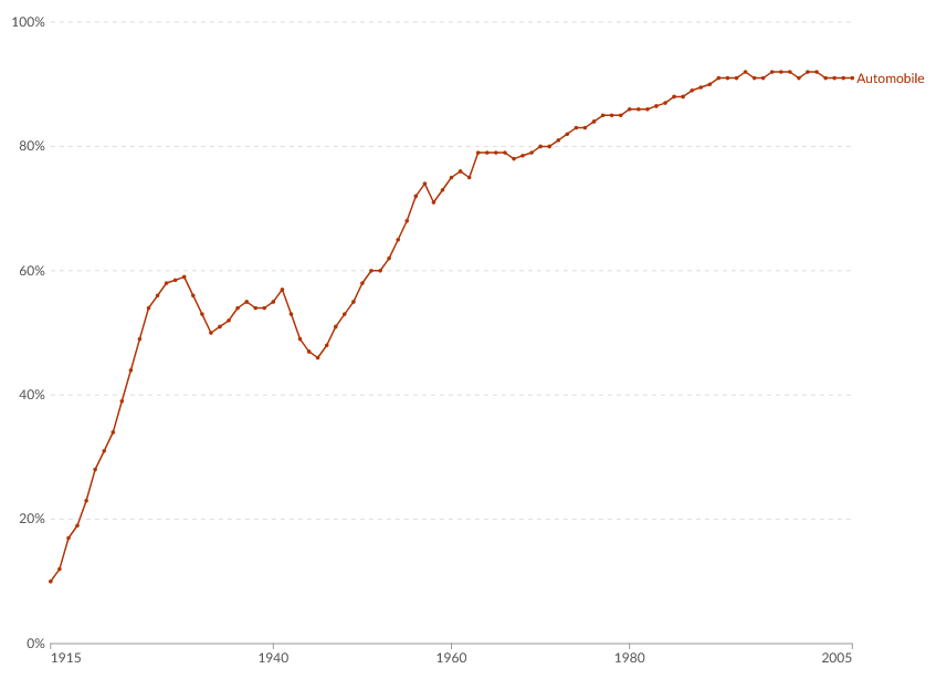
As shown in Figure 1 above, automobile growth has increased nearly every year between 1915 and 2005 (when most people of driving age owned at least one vehicle), excluding the years of the Great Depression and the years during World War II when the United States enforced gasoline rationing to save fuel for the war effort. By 1990, more than 90 percent of households owned a vehicle—essentially everybody of modest income who could safely operate a vehicle.
The city adapted to its increasing automobile traffic by adding and expanding roadway capacity for what was an exploding market with projected, sustained population growth.[23] Los Angeles boasted one of the first urban parkways in the nation, the Arroyo Seco Parkway, connecting downtown Los Angeles to Pasadena. Today, it is known as State Route 110, but to Southern Californians it is the Pasadena Freeway.[24]
Figure 1. Share of American Households Using
Automobiles, 1915–2005
Source: “Share of United States Households Using Specific Technologies,” Our World in Data.
The widespread shift from streetcars and buses to automobiles resulted in increased congestion. Although Los Angeles became famous for its freeways, it has let them stagnate while its population has grown. The Federal Highway Administration’s 1989 Highway Statistics report was the first of its kind to track lane miles per 1,000 people in major urban areas. In 1989, the Los Angeles–Long Beach–Pomona–Ontario Federal-Aid Urbanized Area had 2.2 miles of roadway per 1,000 persons.[25] The latest report from 2023 shows that the Los Angeles–Long Beach–Anaheim Federal-Aid Urbanized Area had just 0.7 miles of roadway per 1,000 persons.[26]
The reduced road network growth has led to congestion. Los Angeles was ranked as the third-most congested urban area in the United States in 2024, just behind the New York City and Chicago urban areas.[27] One reason for this congestion is that the freeway network is not sufficient for the size of the population. The LA Metro area has ranked last or second to last in freeway lane miles per capita of all urban areas for the past thirty years.
Transit advocates point to increased use of public transit as a solution to this increasing congestion. They want to get everybody out of their personal vehicles and onto a train or bus. That might sound compelling, but it is not that simple. First, public transit is not always the most suitable option for commuters who currently rely on cars.[28] As a result, there are limits to how many commuters could use transit even if the system operated optimally.
Additionally, even if a car commuter switches to transit, that by itself will not eliminate traffic congestion. On congested highways, each driver who switches to transit is likely to be replaced by a new driver who would otherwise have made that trip at a different time or not at all. This induced travel is not a negative; it is key to economic activity. But it means that increasing use of public transit by itself is not an effective way to reduce congestion.[29]
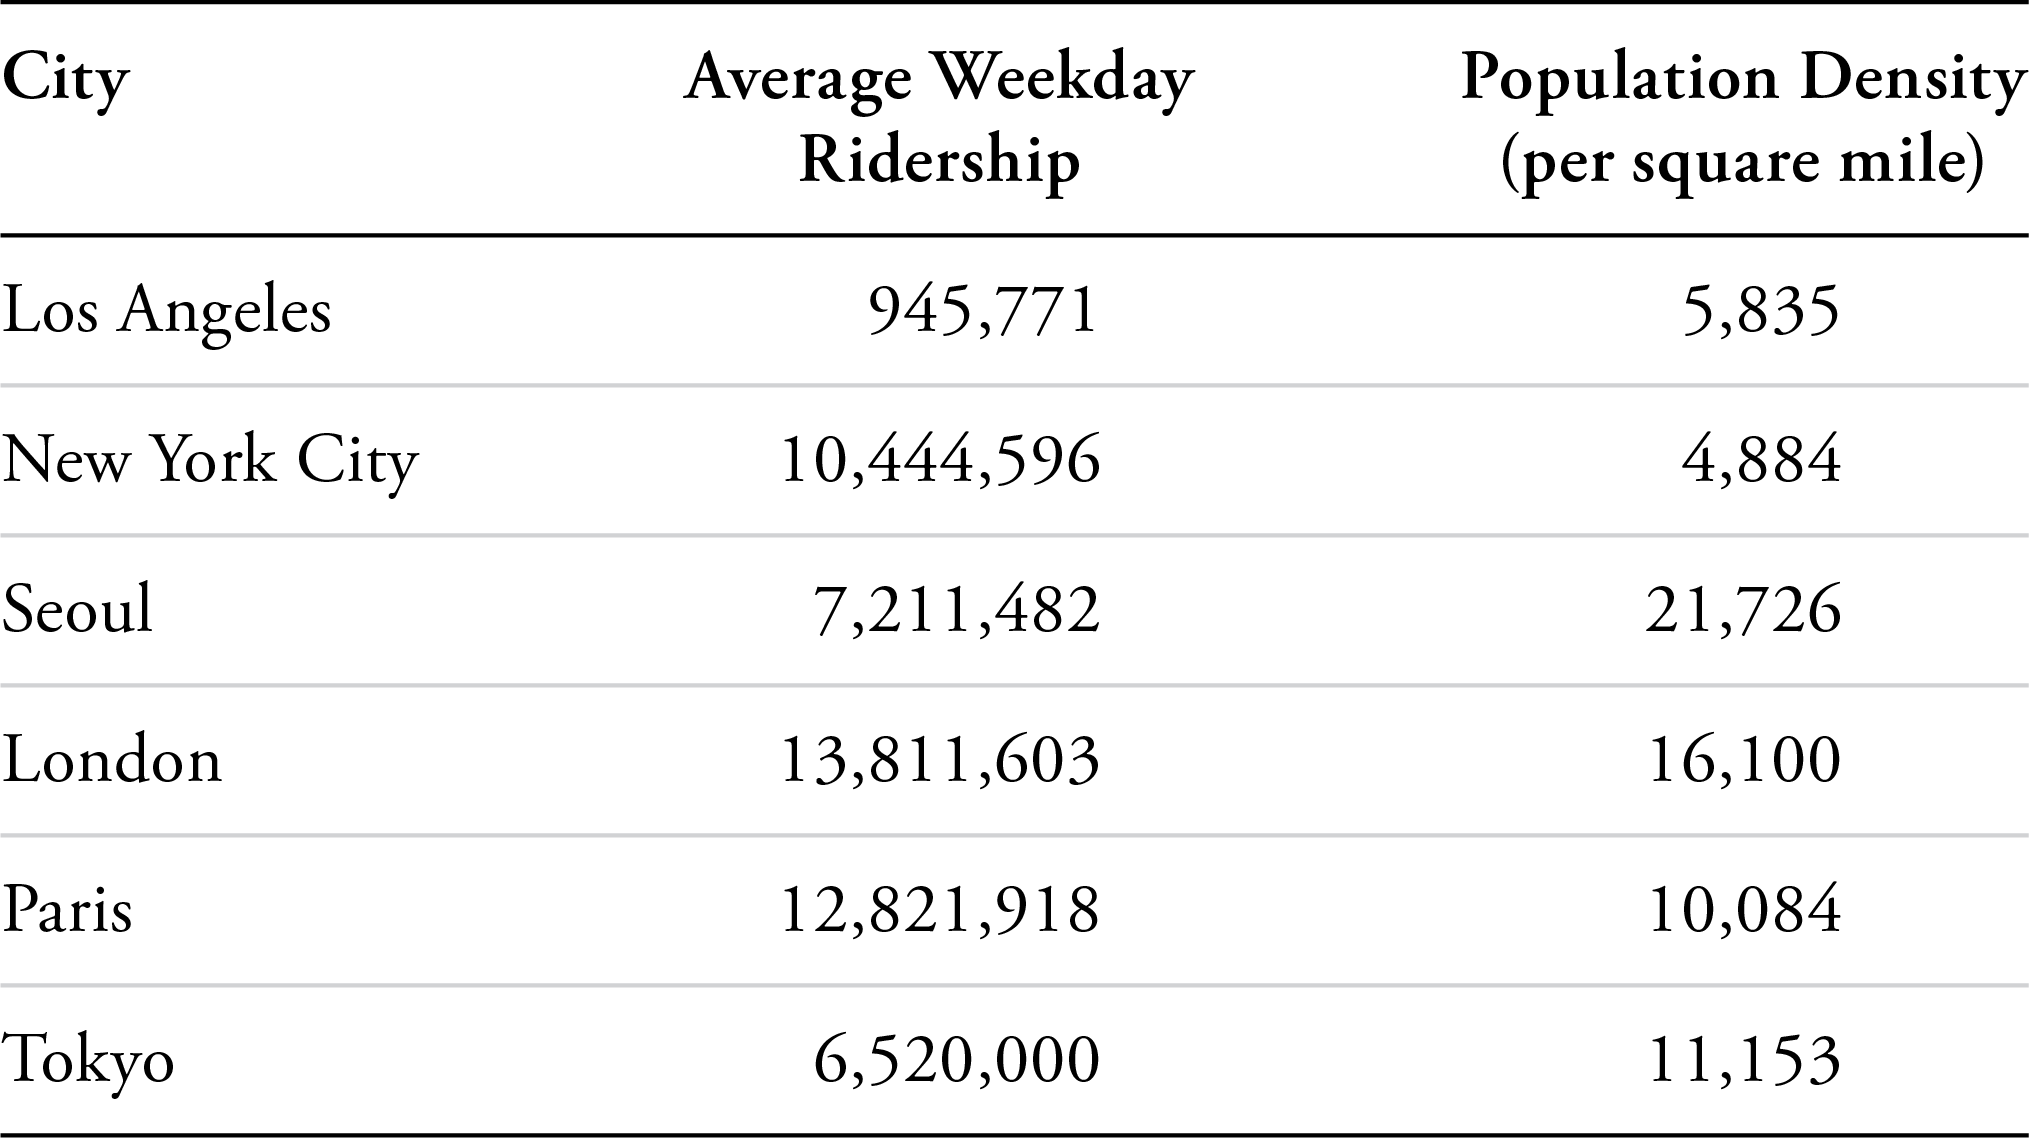
Although transit can provide a valuable service for dependent riders (those who do not have access to a vehicle), it is not a viable alternative to the automobile given Los Angeles’s current population and employment density.[30] (This is despite the fact that the Los Angeles urban area has the highest population density of any major US urban area.)[31] It is also not a great option for many choice riders (those who have access to a vehicle) travelling from point A to point B due to its relative inflexibility and schedule unreliability compared to an automobile.
C. LA Metro Status Quo and Funding Realities
For transit to exist or to be expanded in a city, it must first be funded or financed. As explained in section A of part II, LA Metro has the capacity to both levy a tax (with voter approval) and to sell revenue bonds to finance new capital projects. The Federal Transit Administration (FTA) also provides funding for municipalities looking to expand transit services. This takes the form of aggressive cost-sharing agreements between the federal government and the recipient looking to spend on new capital projects. For a new transit project, the federal government can cover up to 80 percent of project costs (though projects in which the local partner provides a higher share are more likely to be funded).[32]
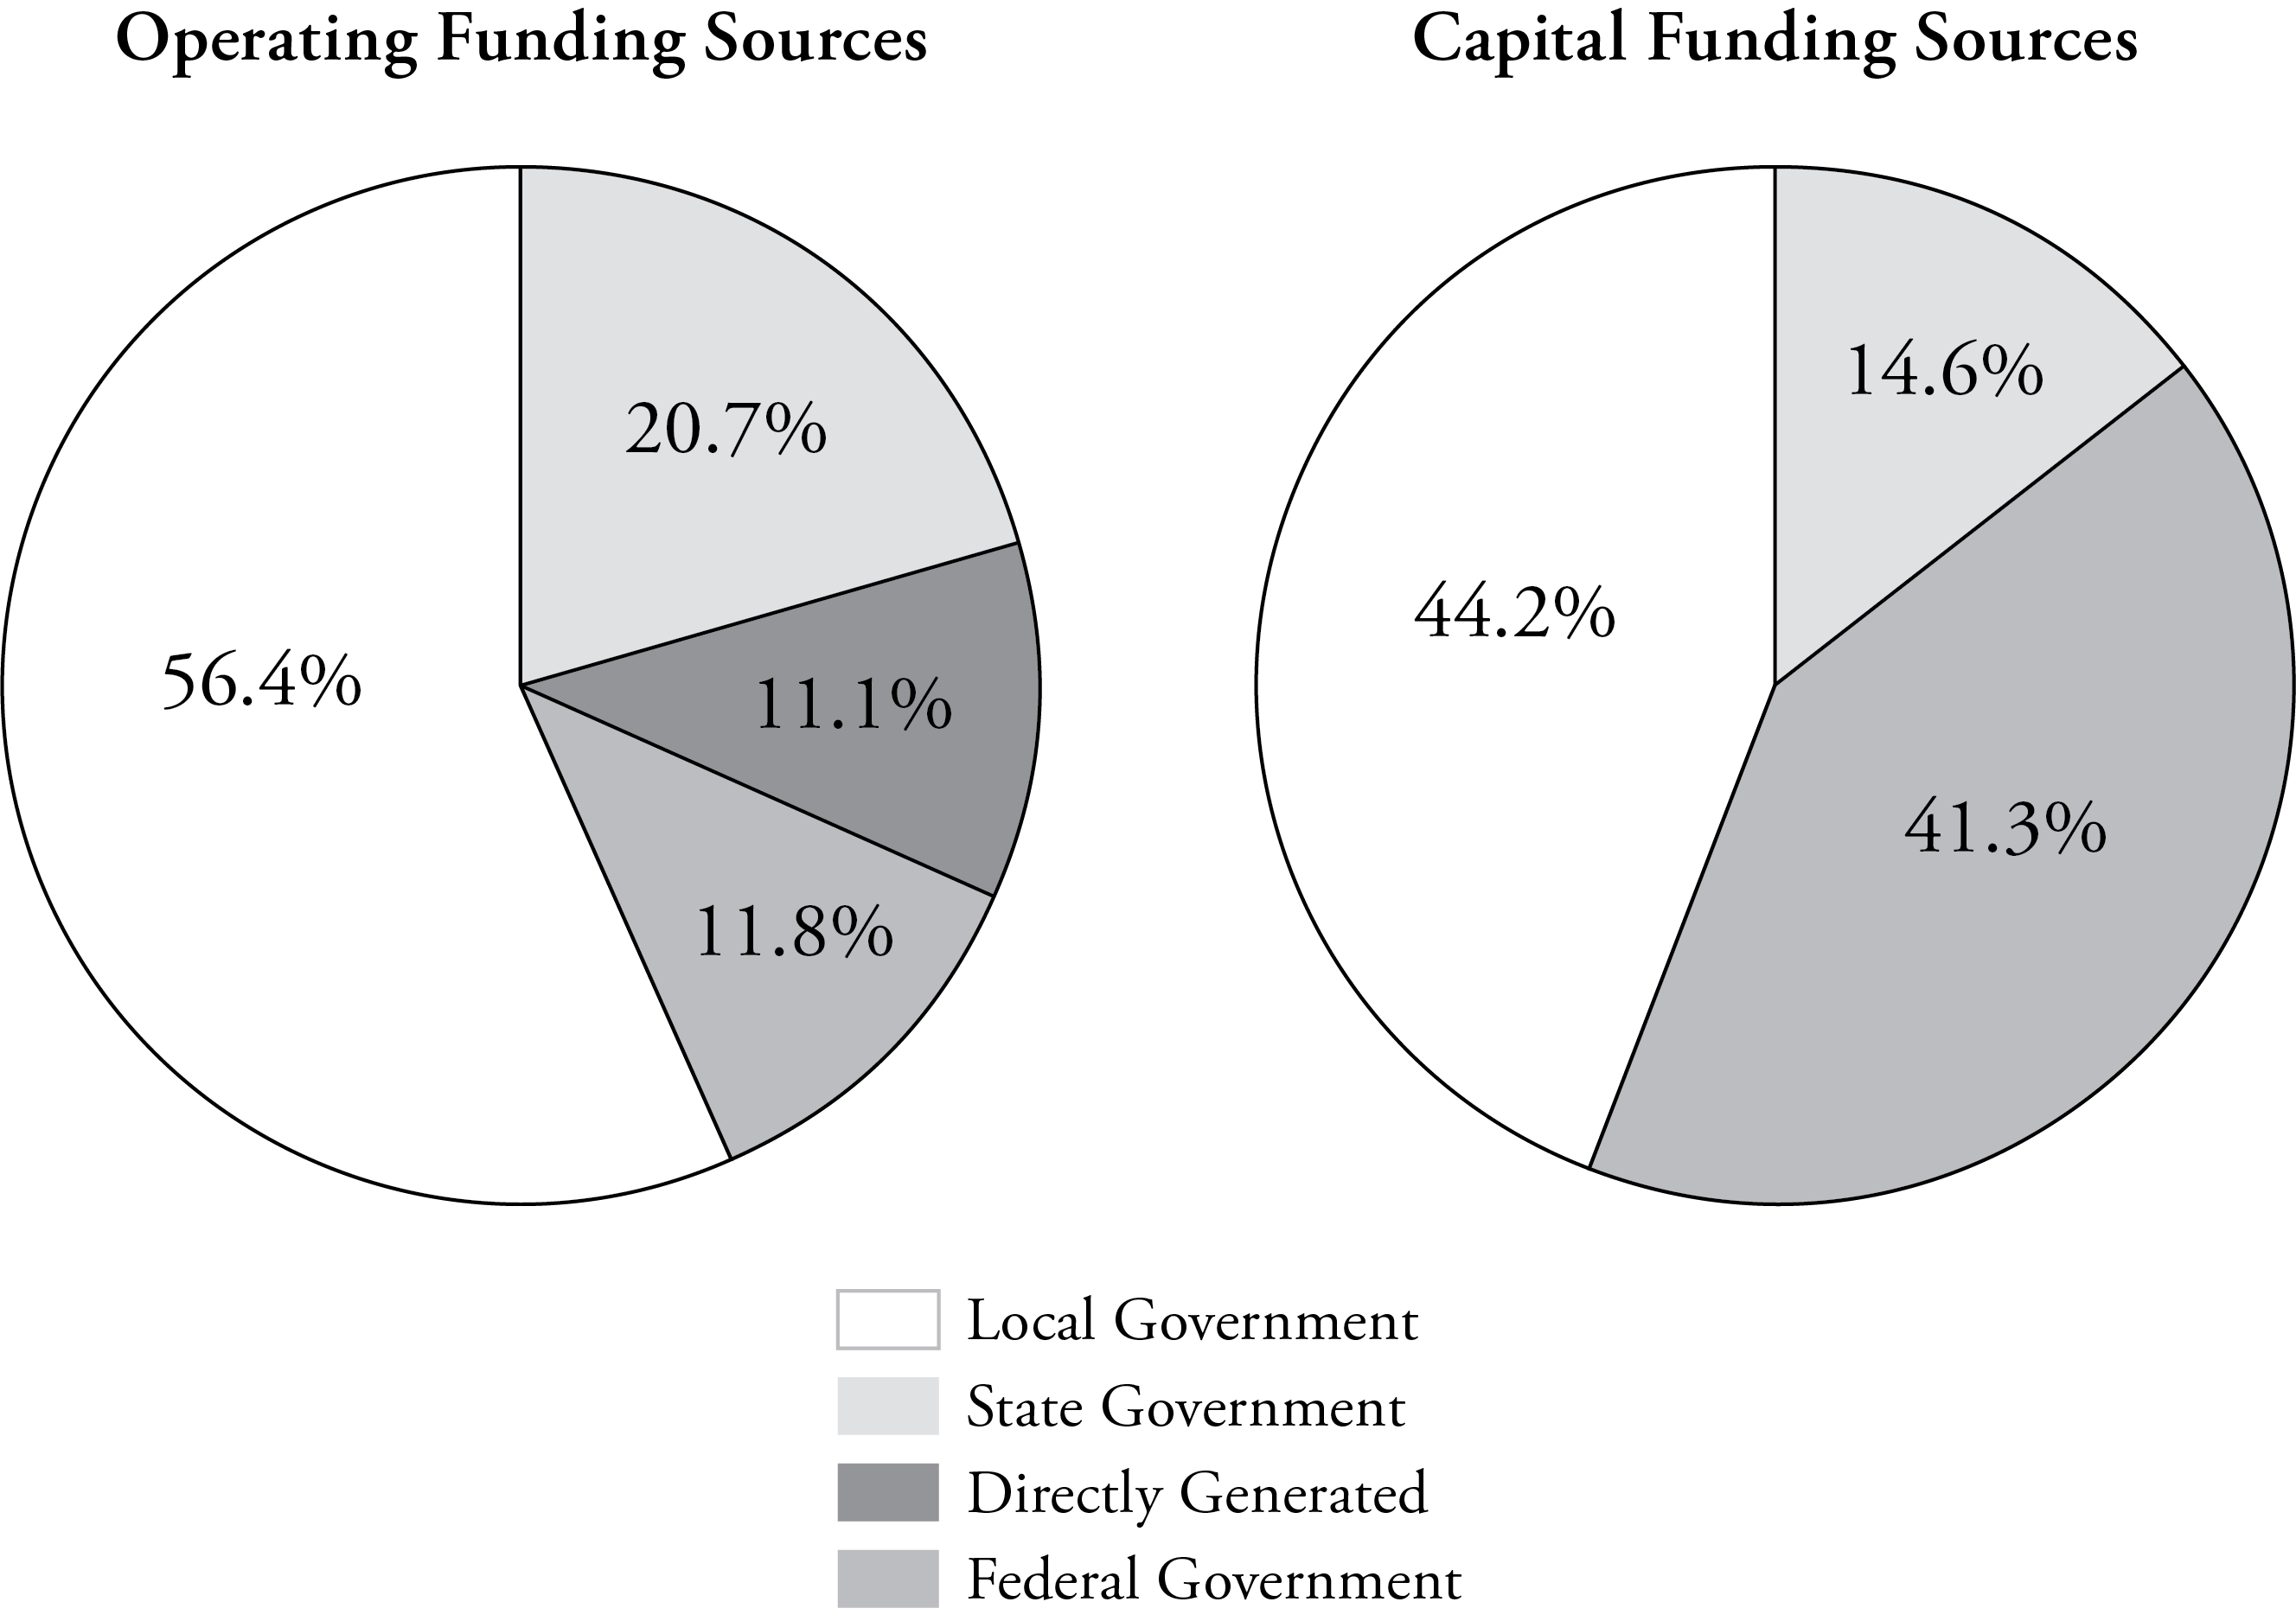
Figure 2. LA Metro Operating Funding Sources and
Capital Funding Sources, 2023
Source: “2023 Annual Agency Profile – Los Angeles County Metropolitan Transportation Authority (NTD ID 90154),” Federal Transit Administration, 2023.
As shown in Figure 2, the majority of LA Metro’s funding is locally sourced. It receives more local funding than all but one transit agency in the nation. LA Metro relies on this funding since it sports a low farebox recovery ratio (how much revenue each service generates from fares divided by total operating costs for the service). The latest National Transit Database report for 2023 shows LA Metro’s vanpool services recover 100 percent of operational costs from fares, whereas every other service, ranging from its motorbus service to its heavy-rail service, only recovers between 3–6 percent of costs from fares.[33]
Additionally, projects may be incentivized (or even required) by statewide statute. Los Angeles is subject to all California statewide transportation mandates passed by the state legislature. For example, AB 1358, the Complete Streets Act passed in 2008, required that local jurisdictions “plan for a balanced, multimodal transportation network that meets the needs of all users of streets, roads, and highways.”[34] LA Metro, subject to this law, had to comply and plan accordingly. (Legislators should consider amending AB 1358 so it does not apply to major arterials.)
Effectively, it becomes harder for a transit agency to insulate natural demand for a service from state-mandated service offerings, creating a demand for capital.
This excess of available capital and statutory demand for service can dilute a benefit-cost analysis, however. With up to 80 percent of the capital costs borne by the FTA (and taxpayers at large), projects that would otherwise be unrealistic and unsustainable become more easily greenlit.
D. LA Metro Operations
Large international transit agencies in cities such as Singapore and Hong Kong have been privatized.[35] (In Singapore, the physical assets are government-owned.) Privatization is a great solution in Asian countries with large population and employment densities; low rates of car ownership; geographic restrictions on development, such as water, that prevent the city from growing spatially; a culture of commuting in tight spaces (the Tokyo metro system has pushers known as oshiya whose role is to squeeze more passengers onto trains); and professional management.[36] These characteristics increase ridership on heavy-rail lines and make them profitable financially. LA Metro has higher passenger loads on rail and bus than many domestic operators, but it still pales in comparison to large international regions.
These physical characteristics of transit in Asia do not exist anywhere in the United States, with the possible exception of New York City. Transit pushers would almost certainly generate backlash among LA riders. As a result, fully privatized transit is not the best option in Los Angeles. The next best alternative to full privatization is some form of public–private partnership (P3). P3s are contracts between the public sector and private companies for the provision of services.[37] P3 agreements specify the allocation of risk, which creates incentives for the private provider to deliver services more efficiently and in a timelier manner than a state entity. Competitive tendering, in which private vendors bid for a contract to operate transit services, is an alternative that could be used more extensively in Los Angeles (although current labor laws, such as Section 13(c) of the Urban Mass Transportation Act, which provides special protections to unionized workers and prevents contracting of many existing services, would negate some of the potential savings).[38]
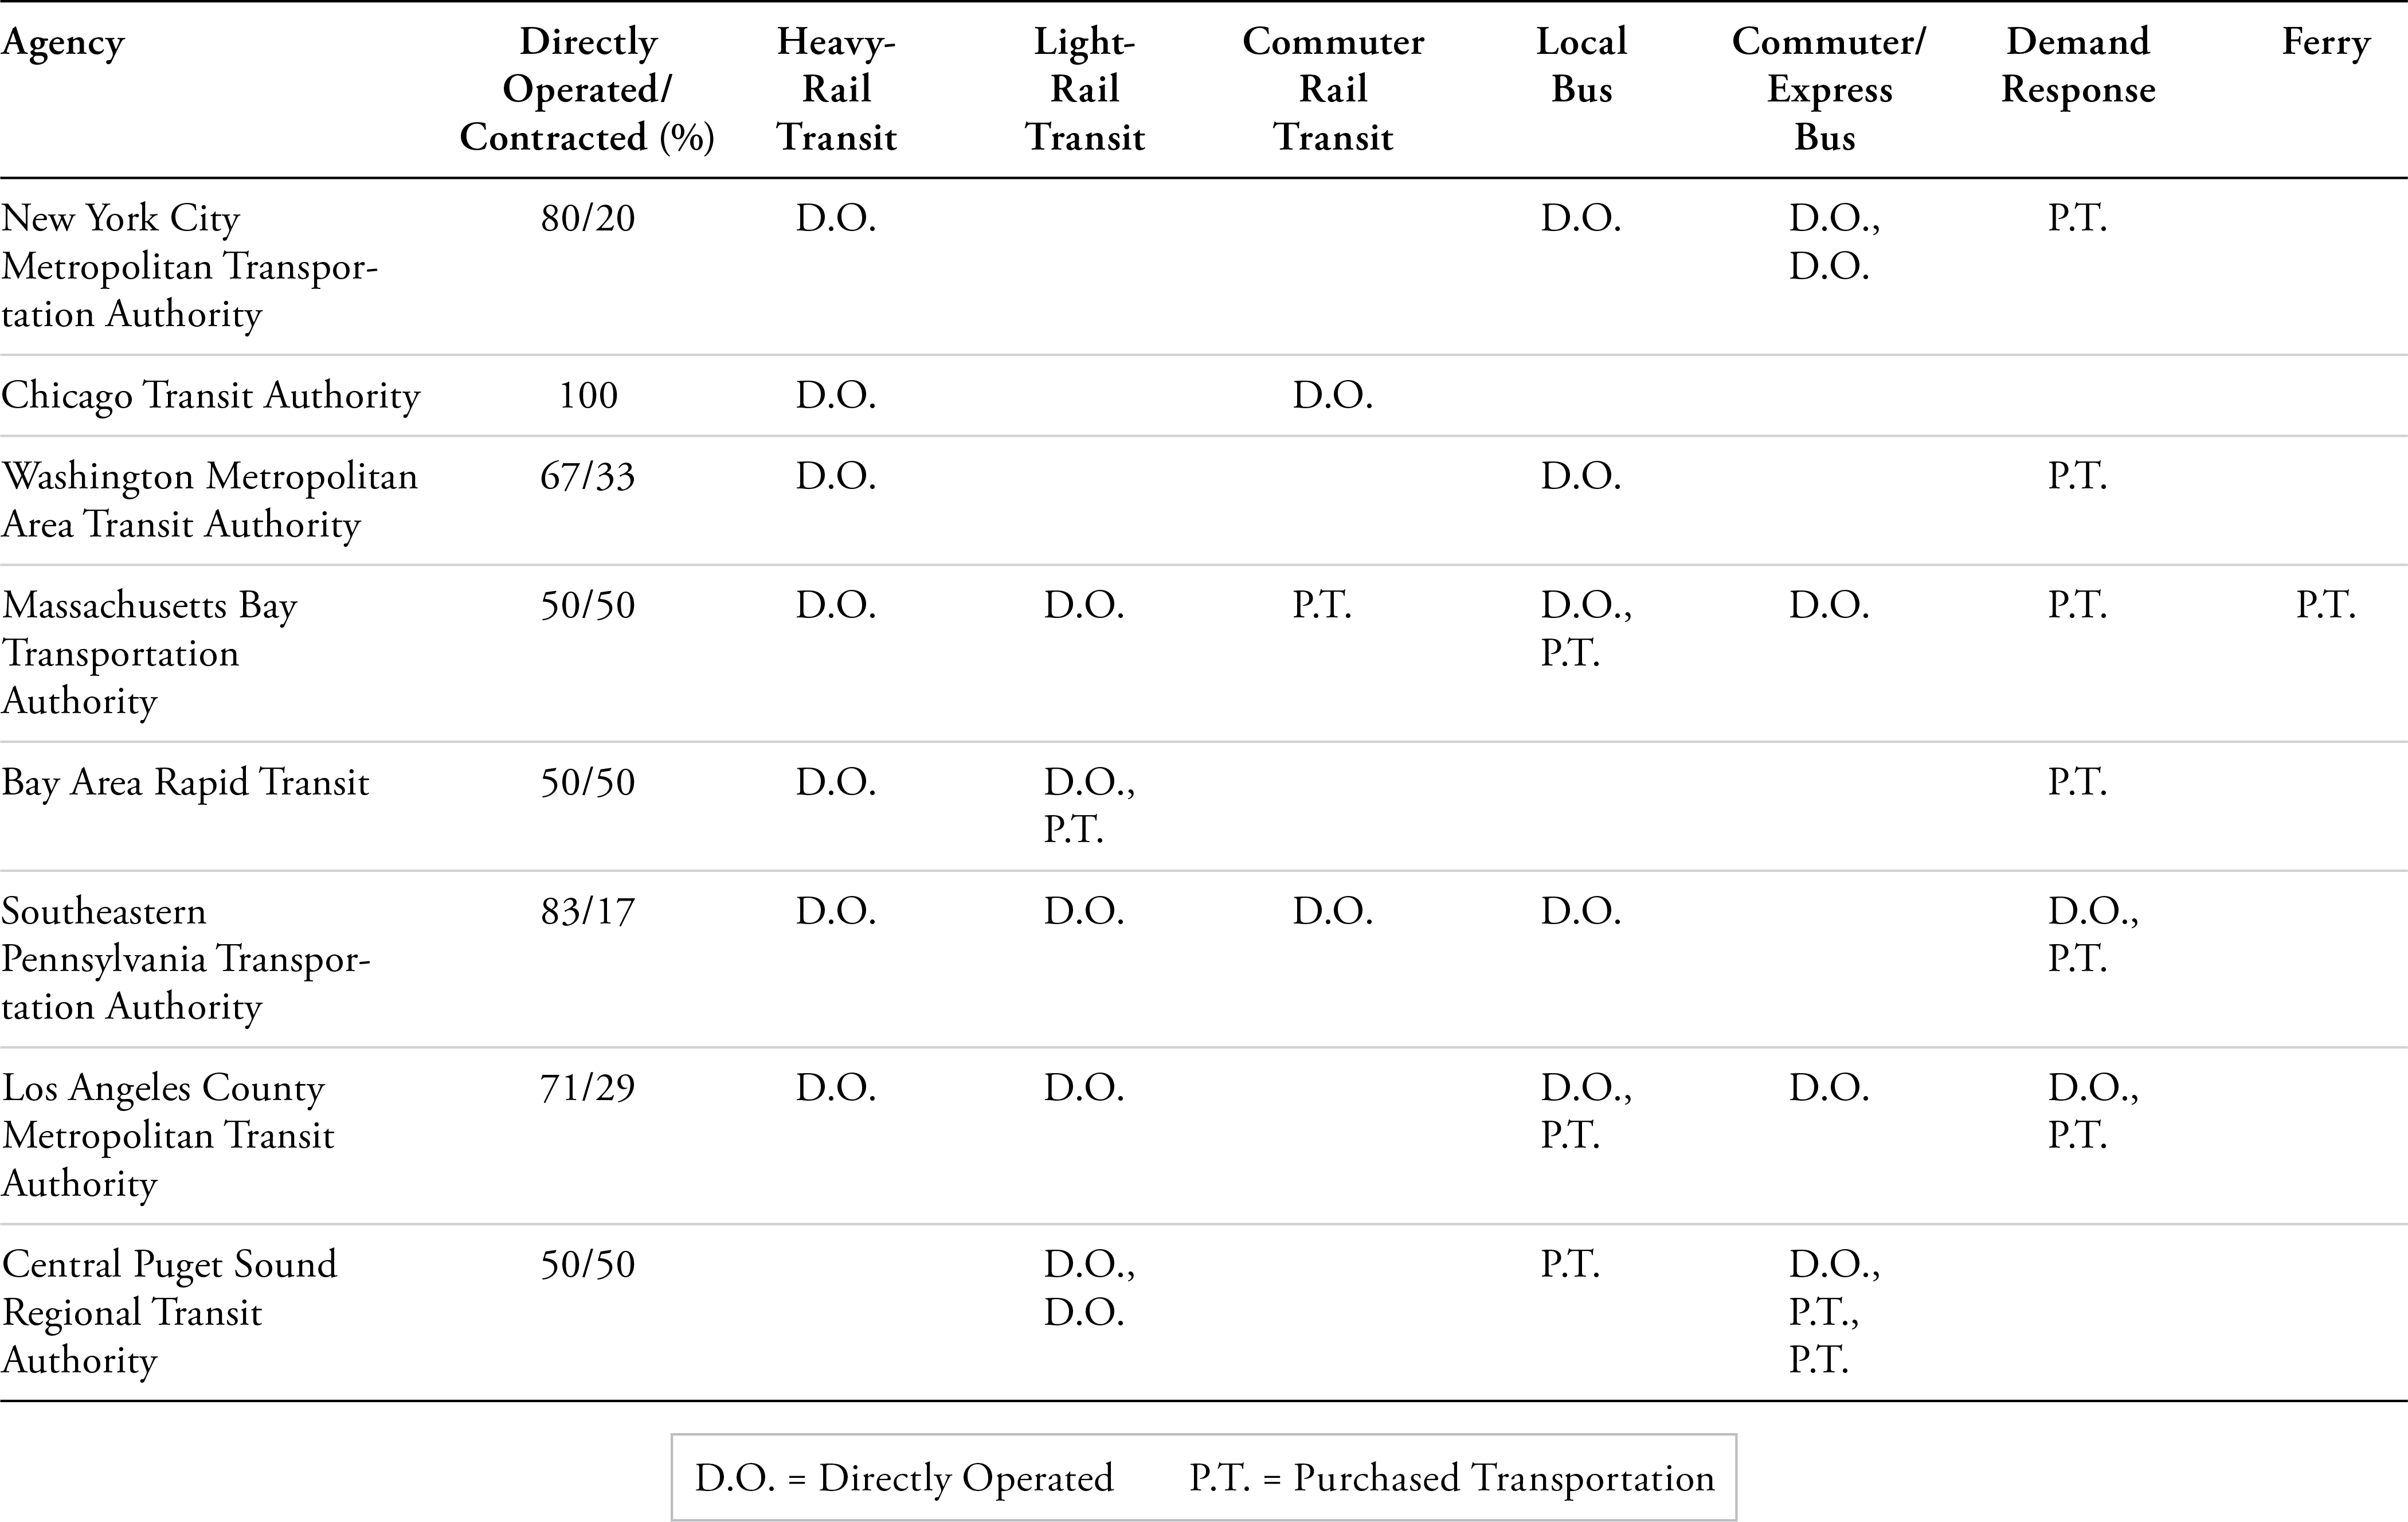
Table 1 compares LA Metro against seven other large transit agencies. The term “Directly Operated,” abbreviated DO, means that the transit agency operates the service in-house; while the term “Purchased Transportation,” abbreviated PT, indicates that the agency contracts, or purchases, its services from another entity. PT is the industry term for contracted service. Oftentimes agencies will operate multiple services for a mode. For example, LA Metro has one paratransit service that it directly operates and another that it contracts (purchased transportation).
The table shows that LA Metro directly operates a larger share of its transit services than most other peer agencies. The agency contracts only 29 percent of its service modes. There are some differences among the agencies; the Chicago Transit Authority only operates two or three types of modes, while the Massachusetts Bay Transportation Authority operates eight modes. Among the agencies that operate four or more modes, however, LA Metro has one of the lower contracting rates. Only New York City Metropolitan Transportation Authority (20 percent) and Southeastern Pennsylvania Transportation Authority (17 percent) contract a lower percentage of their services than LA Metro.
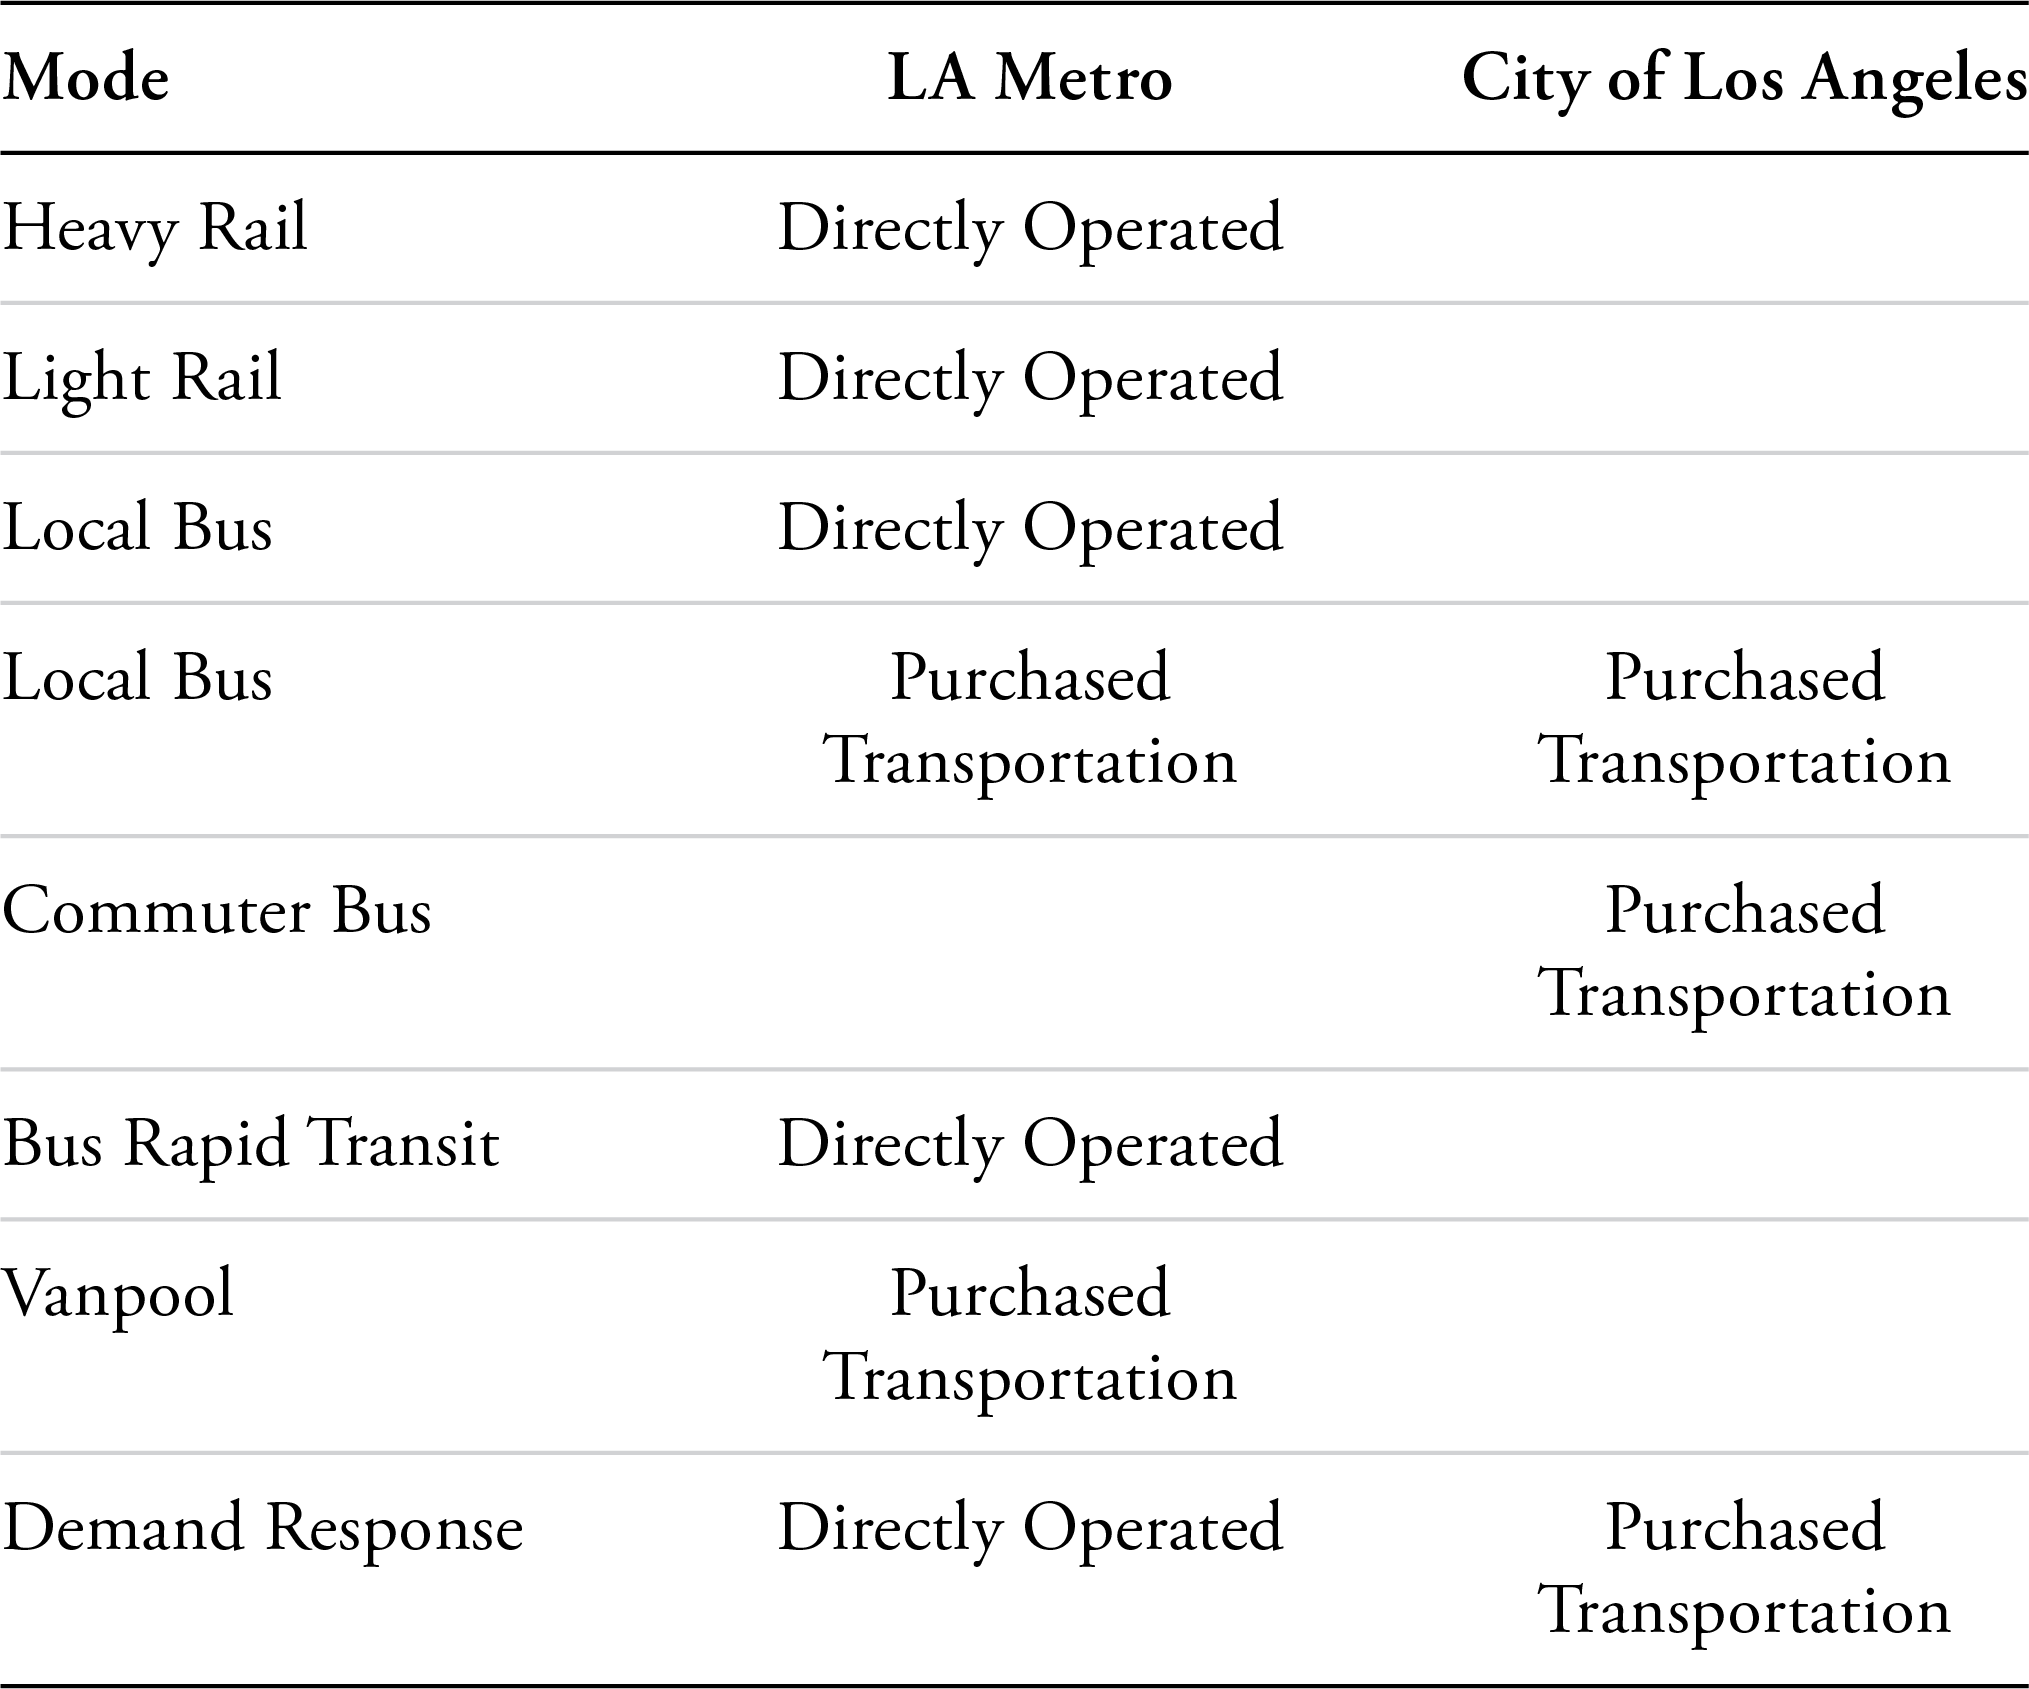
Regionally, LA Metro does not fare much better. Table 2 compares LA Metro’s contracting with that of the City of Los Angeles, another large transit operator in Los Angeles County. The city chooses to contract all of its bus service and its demand response (transit with specialized vehicles for the elderly and disabled), while LA Metro, the county agency, contracts out only a limited part of its local buses and its vanpool operation.
Table 1. Peer Agency Contracting by Mode
Source: National Transit Database, 2023 Annual Database Capital Use, Federal Transit Administration.
One advantage of contracting out is the cost savings. Various studies have shown that contracting results in cost savings of 24–35 percent.[39] Contracting, however, does not always save money. Sometimes it can be more expensive; every corridor is different. Further, the cost savings are not the only advantage of contracting.
The biggest advantage to contracting is the service improvements. In contracting, one entity operates the service and another entity manages the service. This arrangement creates more accountability; if the contractor is performing poorly, the contract can be terminated and service rebid to another operator. If the transit agency operates the service, it is hesitant to punish itself for poor performance. By its setup, agency operation reduces accountability.[40] Transit agencies can evaluate contractors based on a number of metrics including punctuality, customer service, and cleanliness. Good contracts specify exactly for which metrics contractors are evaluated. Model contracts monitor service quality, set clear benchmarks, and allow innovation.
III. Problems
Despite how integral LA Metro is to the city, it still struggles. Some of its problems, such as crime and a lack of system reliability, are seen in other transit systems across the country. Others are more unique to LA Metro, such as persistent cost overruns and delays for new capital projects. This section will explore some of the other major problems that exist in LA Metro’s scope.
A. LA Metro’s Priorities: Rail vs. Bus
One major focus for transit agencies has been finding a balance between bus service and rail service. The two often work as complementary systems, with bus lines terminating near rail stations, but the services have to be funded from the same pot of money. Resources spent on a rail service are resources that cannot be spent on a bus service—and vice versa.
In 1994, this friction between priorities culminated in a lawsuit against LA Metro brought by four named plaintiffs, members of the Bus Riders Union.[41] The lawsuit alleged that LA Metro spent a disproportionate amount of its budget on rail lines and bus systems that benefited richer, white suburbanites at the expense of inner-city, transit-dependent minority groups.[42] This outcry started largely because of LA Metro’s move to stop offering monthly bus passes, but also cited other concerns such as overcrowding on existing bus lines, service instability and unreliability, and a general neglect of LA Metro’s bus fleet.[43]
The plaintiffs argued that this neglect violated the Civil Rights Act of 1964 and the Fourteenth Amendment of the United States Constitution. The district court agreed, and issued a consent decree saying as much. As a result, LA Metro’s plans to stop offering the monthly pass were curbed, and the price was lowered from $49 to $42. It also established a new $11 weekly bus pass and expanded the bus fleet by 152 buses.[44] The consent decree led to large increases in transit ridership at a low cost, at least compared to the construction of rail lines.[45]
After the consent decree expired in 2006, however, LA Metro reverted to some of its old ways, again ignoring transit-dependent customers in its quest to increase its transit-choice ridership.
Table 2. LA Metro and City of Los Angeles Bus
Service Operation
Source: National Transit Database, 2023 Annual Database Capital Use, Federal Transit Administration.
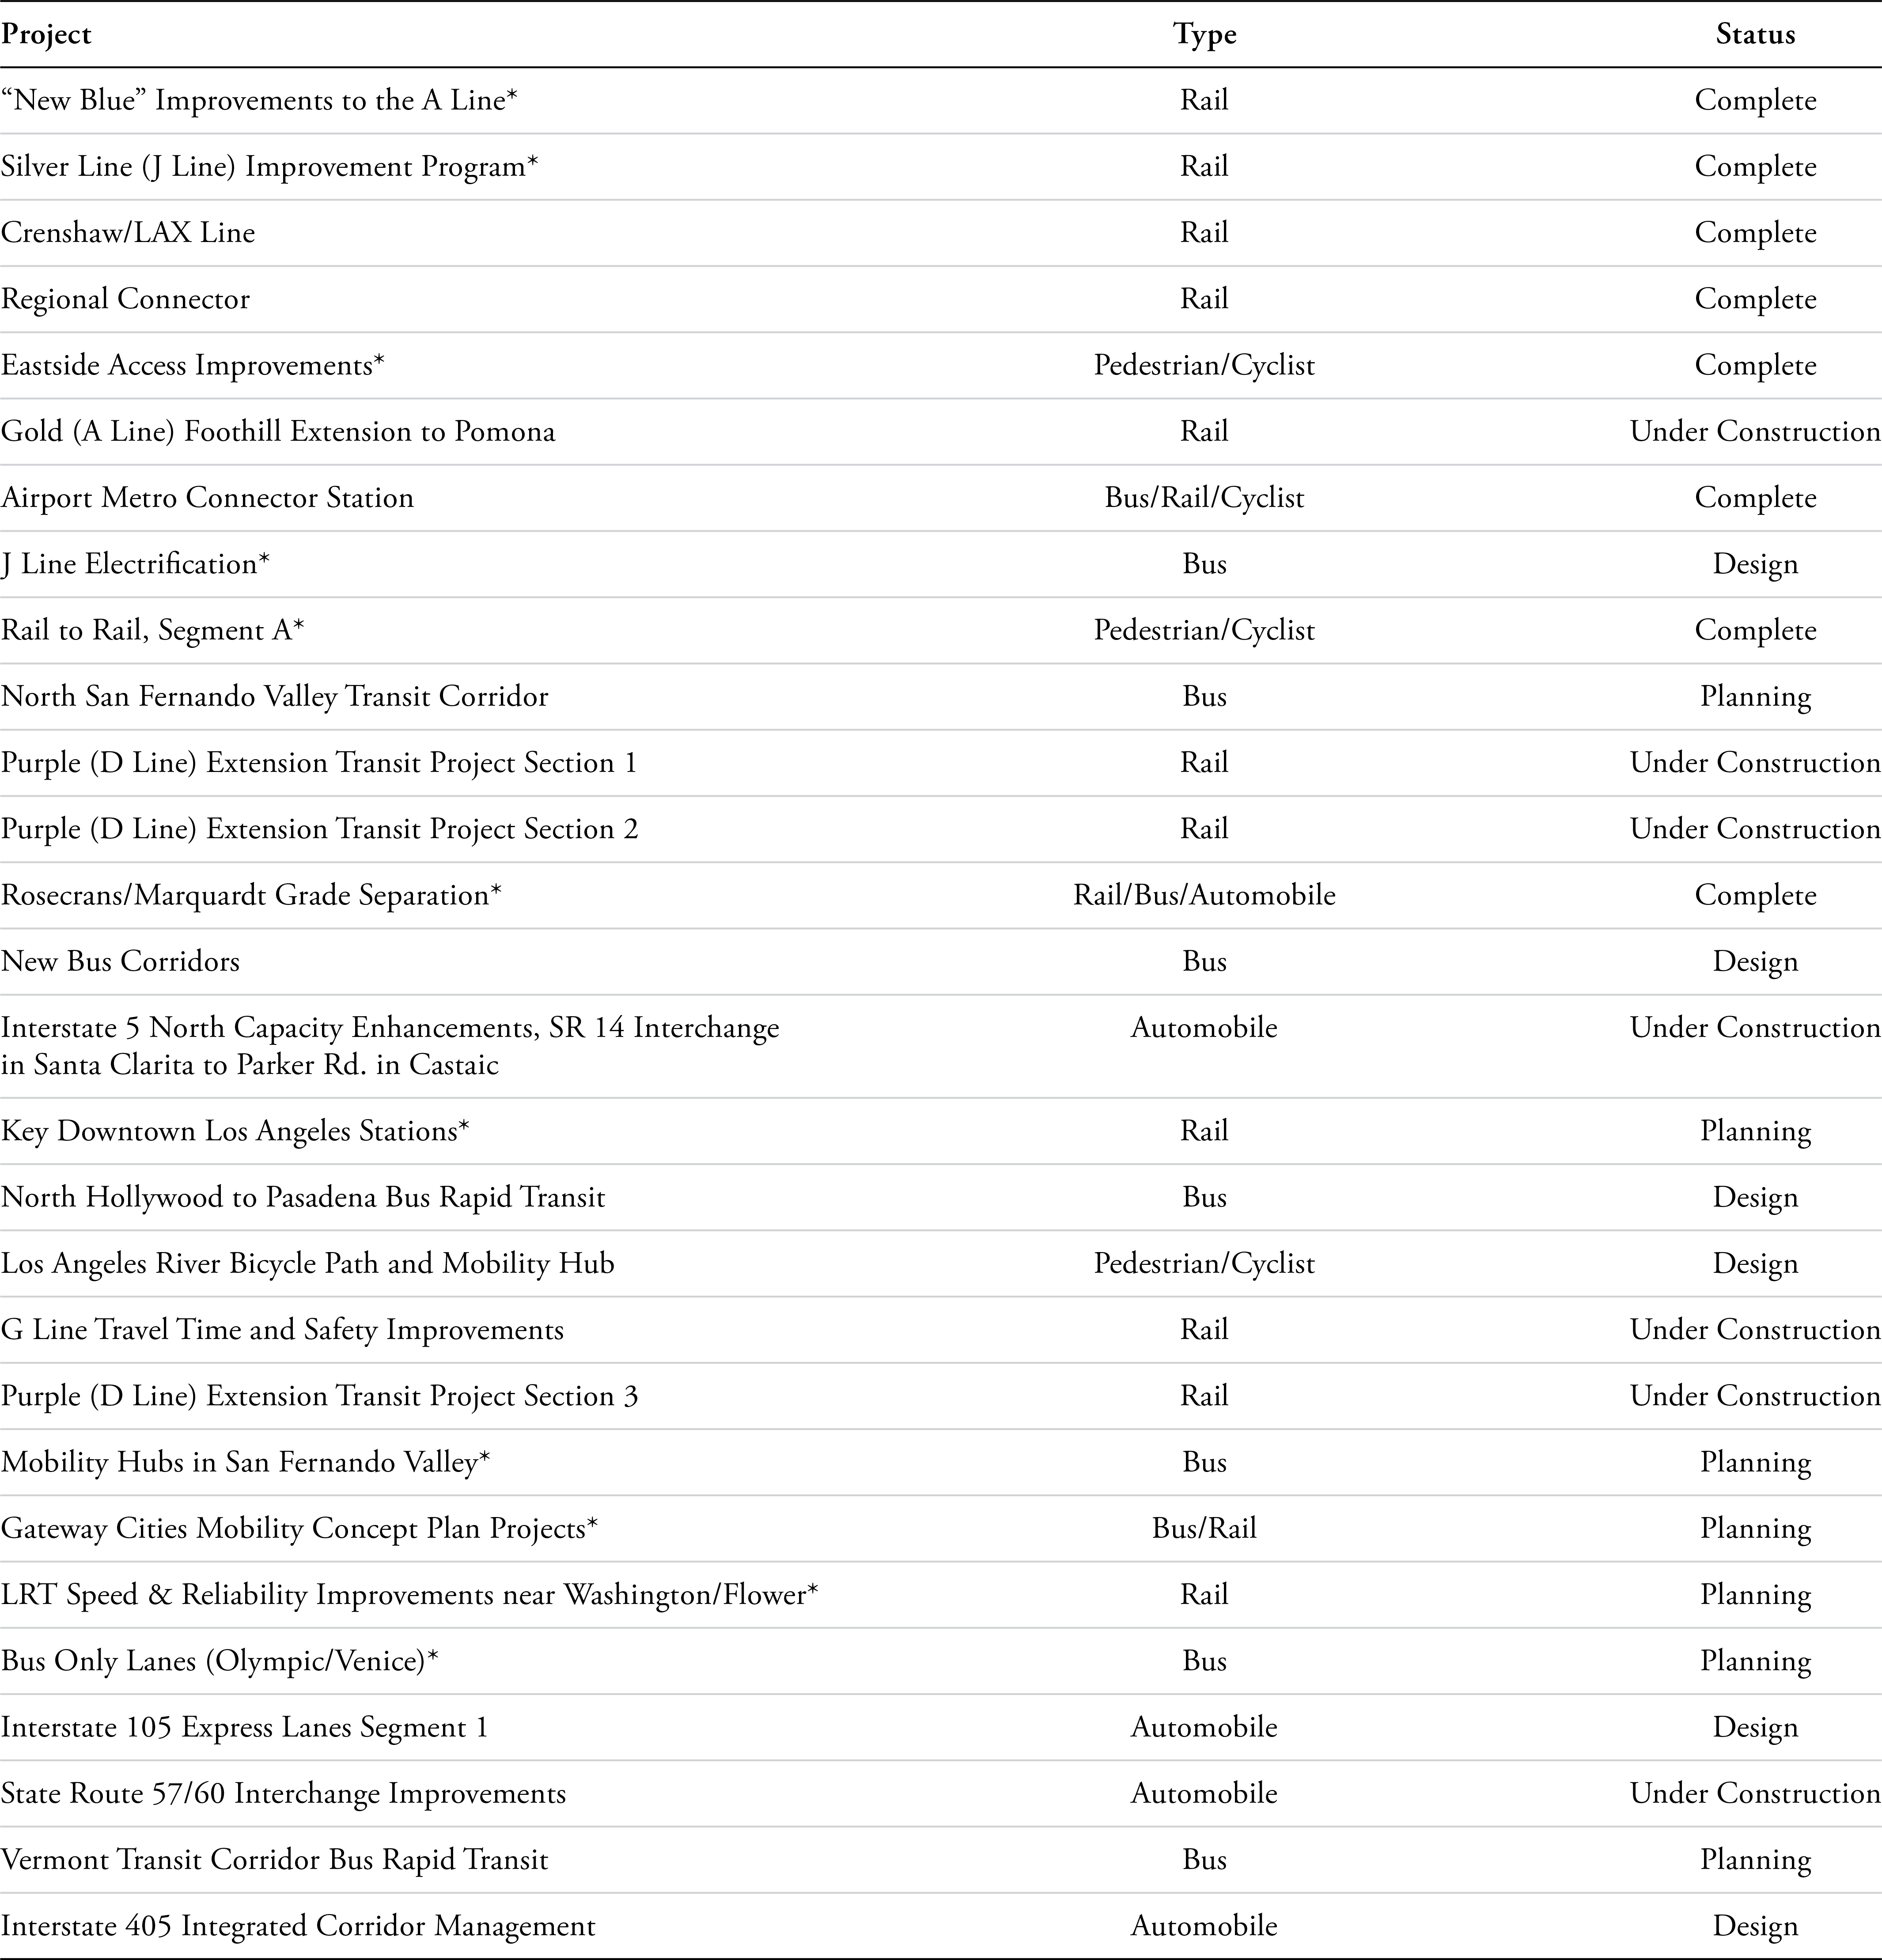
In November 2017, Los Angeles Mayor Eric Garcetti unveiled the “28 by ’28” initiative.[46] The initiative was a list of proposed transportation projects leading up to the planned 2028 Summer Olympics, being hosted in Los Angeles, with staggered expected opening dates over the decade leading up to the Olympics.[47] Sixteen of the initial projects fell under Measure R (a half-cent sales tax approved by voters in 2008) and Measure M (another half-cent sales tax approved by voters later, in 2016) and were already in progress.[48] Considering that bus riders make up 59 percent of LA Metro’s ridership, the project list was heavily biased in favor of rail projects, with a smattering of highway projects included. The remaining twelve were new projects altogether.[49]
Some projects were replaced with others to meet the 2028 deadline. Even with these substitutions, a March 2024 report from LA Metro showed that ten of the revised list of projects (the projects labeled “Under Construction”) were on pace to open after 2028, despite what Metro’s own website claims.[50] At the time of publication of this report, per LA Metro’s website, eight projects are completed, and twenty are anywhere between planning and under construction.[51]
Table 3. Revised LA Metro 28 by ’28 Project List by Type and Status
Source: “28 Projects by 2028,” LA Metro.
Half of these twenty-eight projects have a rail component, though some involve multiple modes. Others focus wholly on buses, automobiles, or pedestrians and cyclists. Whether this focus on rail projects will receive a similar challenge, in the form of a lawsuit or otherwise, from groups like the Bus Riders Union remains to be seen. The 28 by 2028 initiative may push the balance one way or another between rail and bus.
Table 4. Los Angeles Light-Rail Lines Costs

Source: “Eno Selects Final Case Studies for Ongoing Research into Transit Cost Delivery,” Eno Center for Transportation, October 9, 2020.
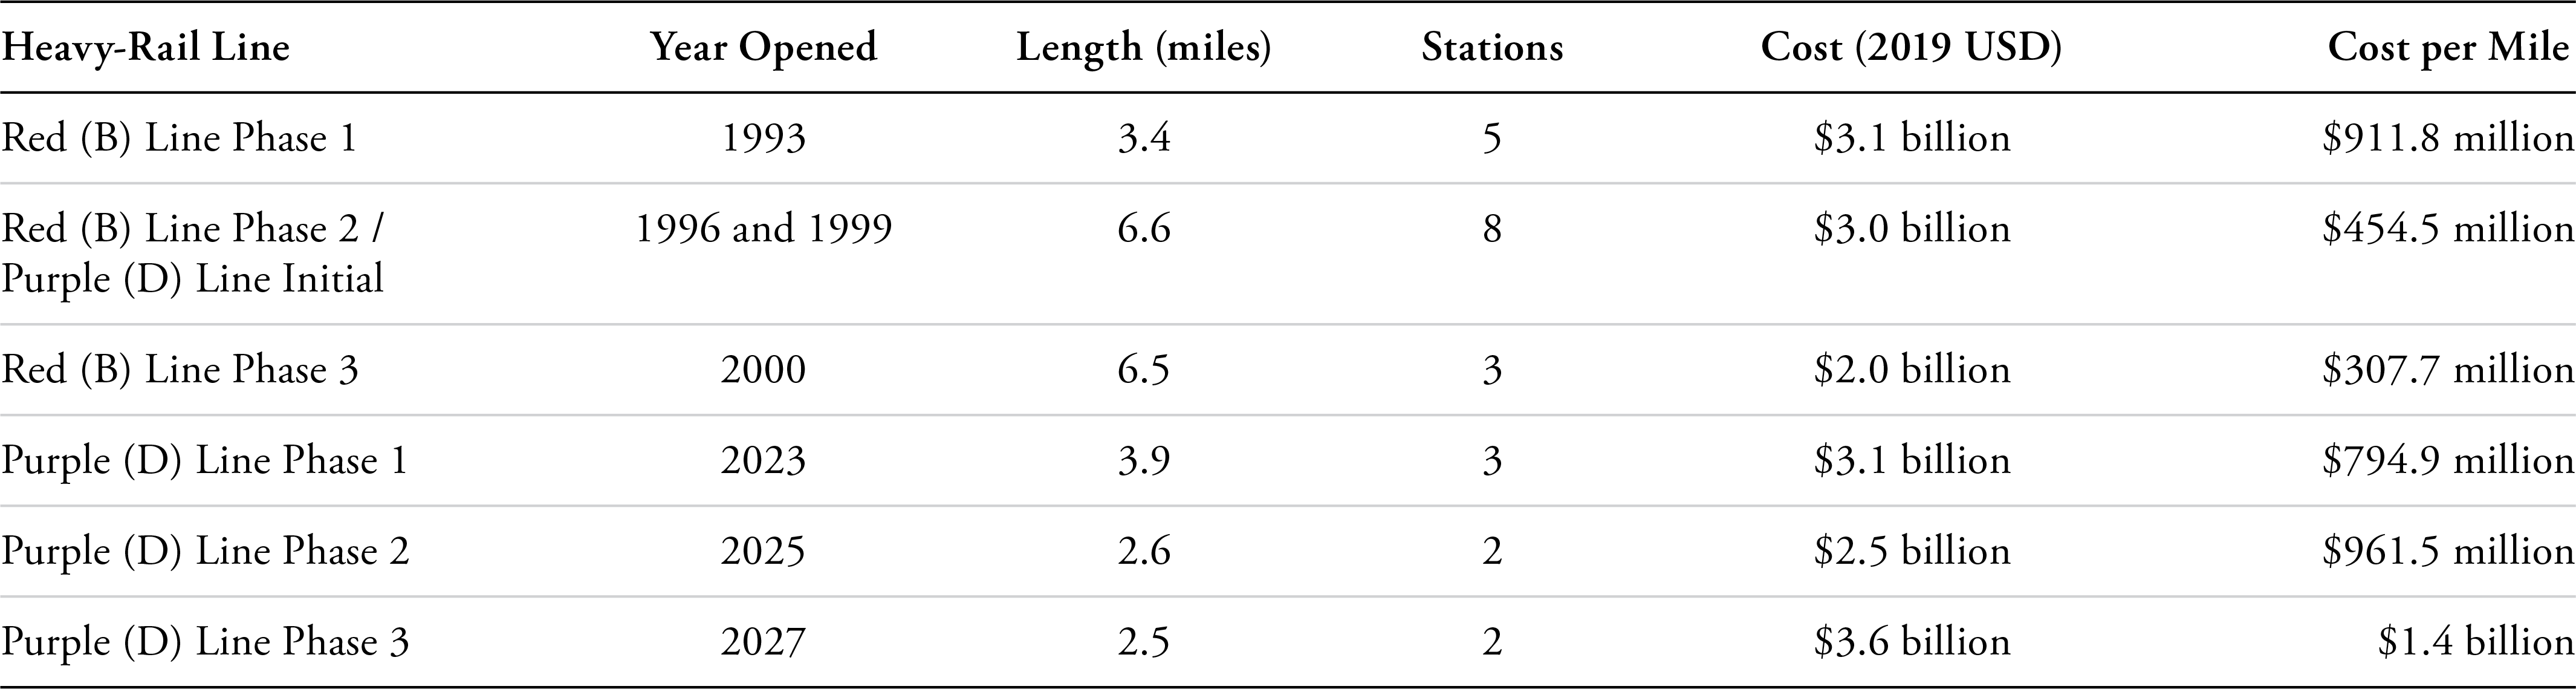
Table 5. Los Angeles Heavy-Rail Lines Costs
Source: “Eno Selects Final Case Studies for Ongoing Research into Transit Cost Delivery,” Eno Center for Transportation, October 9, 2020.
In 2019 (the last pre-pandemic year), ridership on LA Metro’s directly operated service, including bus, light-rail, and heavy-rail, was 370 million.[52] This was a huge decline from its peak year of 1985, when 497 million passengers were carried. If anything stands out as an LA Metro failure, it is that after developing one of the strongest rail systems in the nation, its ridership fell by nearly a quarter. While LA Metro may claim that this ridership decline is a result of the pandemic, the system was losing riders for years before COVID. Even in 2024, LA Metro only had 311 million riders—below the pre-pandemic numbers by 16 percent.[53] There is no data to support the claim that LA Metro will carry 500 million passengers, even with the new rail lines under construction.
B. Cost Overruns and Delays
Setting a tight deadline on transit projects is challenging across the United States, but this is especially true in Los Angeles. Throughout its history, LA Metro’s projects have been plagued with cost overruns and delays.
The Eno Center for Transportation took case studies from different metro areas in the country, looking at both light- and heavy-rail transit projects to evaluate their cost per kilometer (adjusted to miles for this report).
Los Angeles’s average cost per mile of light-rail is $88.98 million, and the average cost per mile of heavy-rail is $707.11 million.[54] Domestically, the Eno study looked only at light-rail comparisons. Los Angeles’s costs may seem reasonable, but the fact that some of the cities the Eno report examined have higher per-mile costs than Los Angeles does not mean the spending is acceptable. For the record, Los Angeles’s $55.25 million per mile average is far lower than Seattle’s $325.87 million per mile, but only slightly lower than Minneapolis’s $56 million per mile and Denver’s $57.67 million per mile.[55]
Table 6. Average Ridership and City Population
Density
Sources: Column 2 from a mix of sources. Seoul’s ridership data from “Seoul Subway Transportation Statistics,” Seoul Open Data Plaza. Tokyo’s ridership data from “Business Status,” Tokyo Metro, June 23, 2025. Column 3 data from “Demographia World Urban Areas 19th Annual Edition,” Demographia, August 2023.
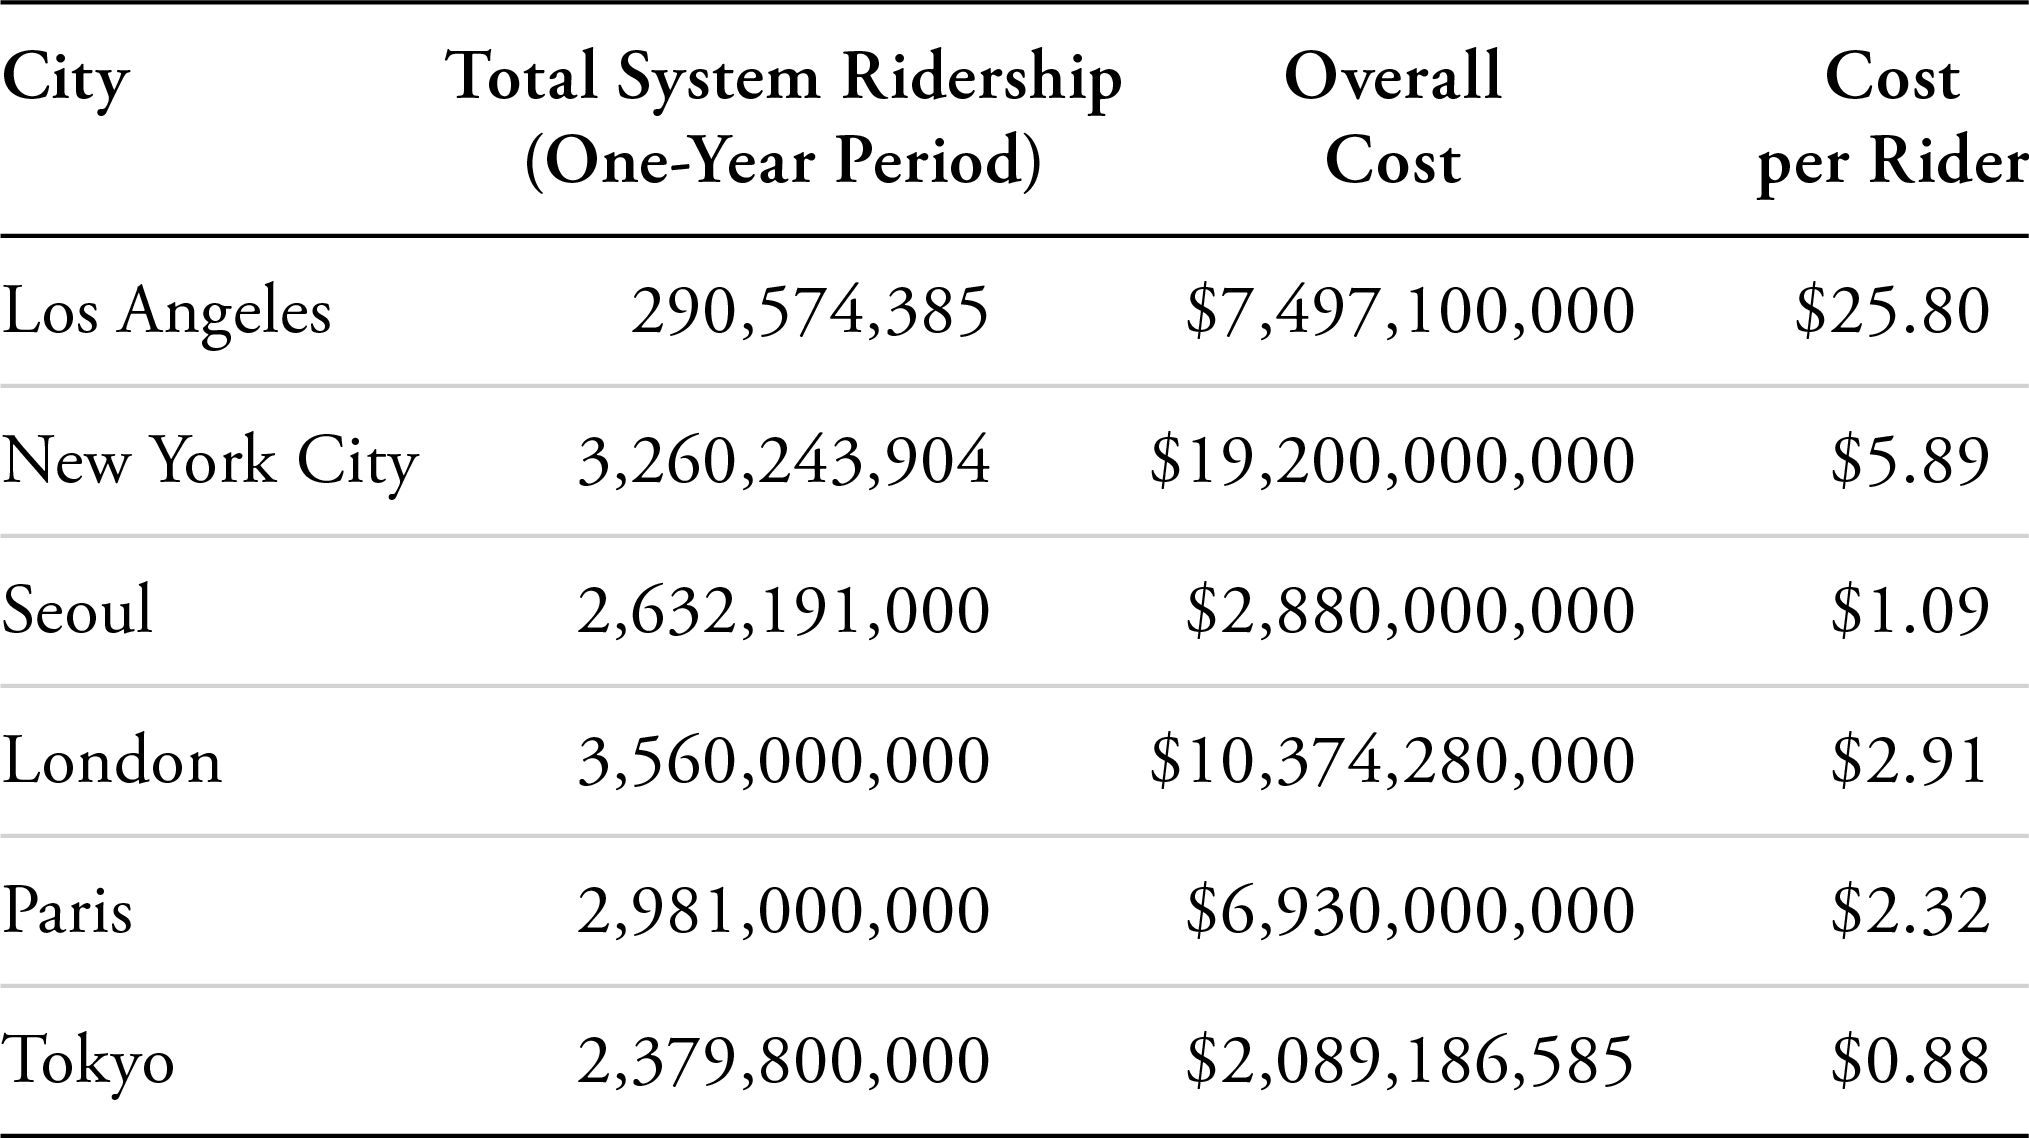
Compared to other countries, LA Metro’s costs are worse. Paris and Madrid’s metro systems are heavy-rail systems, so it is best to compare them to LA Metro’s heavy-rail costs. The average cost per mile of Paris’s metro lines was $313.51 million compared to Los Angeles’s $707.11 million.[56] Paris’s tram system, more akin to a streetcar system in Los Angeles, was around $76.26 million per mile—close to Los Angeles’s cost per mile, but still lower, and for a less complex and grade-separated type of system.[57]
Madrid’s heavy-rail system shows an even wider gap. Madrid paid an average of only $168.29 million per mile of heavy-rail, $539.13 million per mile less than Los Angeles.[58] Madrid’s tram system, however, had an average cost of $84.47 million per mile, much closer to Los Angeles’s average cost per mile, but again for a simpler type of streetcar system.[59]
Based on these case studies, the biggest source of Los Angeles’s cost overruns is the high delivery cost of heavy-rail projects. For example, the Purple Line Extension significantly exceeded typical international costs, at least when compared to Paris and Madrid.
Table 7. Los Angeles Cost per Rider Compared to
Other Cities
Sources: RATP Group Press Release, March 8, 2024. LA Metro costs from “Fiscal Year 2023 Year End-Financial and Performance Report (Preliminary),” LA Metro, November 29, 2023. New York City MTA and LA Metro ridership from “Complete Monthly Ridership (with Adjustments and Estimates),” National Transit Database, Federal Transit Administration, April 2024. New York City MTA costs from “Report on the Calendar Year 2023–2026 Adopted Plan for the Metropolitan Transportation Authority,” New York City Council Finance Division, March 9, 2023. London ridership from “Transport for London Quarterly Performance Report,” Transport for London, May 2024. London costs from “Annual Budget for 2023/24 Shows TfL Set to Deliver Operating Surplus,” Transportation for London, March 22, 2025. Tokyo Metro’s ridership from “Business Status,” Tokyo Metro, June 21, 2024. Tokyo costs from “Financial Highlights (Consolidated),” Tokyo Metro. Seoul ridership from “Seoul Subway Transportation Statistics,” Seoul Open Data Plaza. Seoul costs from “Company Information,” Jobs Korea.
This is, at least in part, due to the impact of delays on project costs. When a project is delayed, costs increase, a difference that is felt sharply in transit projects. The Westside Subway (or Section 1 of the Purple Line Extension) broke ground in 2014 and was forecast to cost $2.8 billion, with an opening year of 2023.[60] A Streetsblog LA article by Joe Linton tracked the increases from the project’s conception to its opening. In 2020, another $200 million (or a 7 percent overrun) was approved, then another $150 million (5 percent) in 2021,[61] and most recently, another approval of $225 million in 2024. Those increases amount to an escalation of 20 percent more than the original budget.[62]
Linton noted that this was not the only Purple Line–related increase. After the contract was signed, but before construction began, the Section 2 construction team anticipated an approximate $125 million overrun, and the rail yard supporting all three Purple Line sections expected to need $50 million in addition to earlier expectations.[63]
Another problem is the cost of construction in Los Angeles. Almost everything from tunneling (due to labor rules) to materials (due to Buy America provisions) to worker compensation (due to prevailing wages) is two to three times more expensive in Los Angeles than the worldwide average for developed countries.[64] Unless California and the federal government reform project delivery in the United States, building major infrastructure will remain at least twice the cost of building it in other Western countries.
C. Metro Leadership
LA Metro is coordinated by the Metro Board of Directors. This board is made up of representatives from the City of Los Angeles, the County of Los Angeles, other incorporated cities and unincorporated areas in Los Angeles County, and a non-voting member representing the governor.[65]
In total, the composition is:
Four representatives from the City of Los Angeles, comprised of the mayor of Los Angeles and three appointees who are appointed by the mayor of Los Angeles;
Five representatives from Los Angeles County, one for each of the five county districts;
Four representatives appointed by the Los Angeles County City Selection Committee; and
One non-voting member appointed by the governor of California.
Some of these members are appointees, not necessarily transportation policy experts, financing experts, construction experts, or people with a background in any area relevant to managing LA Metro or a large urban transportation network. Board selection is not necessarily based on technical knowledge. Instead, selection can be swayed by political connections and favors based on political ability, as opposed to transportation knowledge or planning background.
Likewise, because officials are appointed or elected on grounds unrelated to transportation, there is no real incentive tied to LA Metro’s performance. The board may try to bring down costs, but even when costs are lowered, the board simply spends more on other projects. Further, with the federal cost-sharing agreements offering to pay for 80 percent of new transit project capital costs, there is no incentive to lower costs.
D. LA Metro Employees
While the majority of employees are diligent and do their jobs, a minority have found a way to rig the system by either not acting in good faith or racking up excessive overtime pay. At times, drivers are staging strikes and sick-outs.[66] In June 2024, at least forty routes were severely delayed because hundreds of drivers staged a sick-out. Those drivers were upset about working conditions, and while some of their concerns about safety and management may have been legitimate, it inconvenienced thousands of riders. Partly as a result, system ridership has been declining for the past ten years, with ridership almost 50 percent less than what it was in 2013.[67] Safety, the dispersion of jobs from downtown, and working from home are other key factors.
Table 8. Los Angeles Transit Services Peak-Hour On-Time Performance and Average Headways by Mode
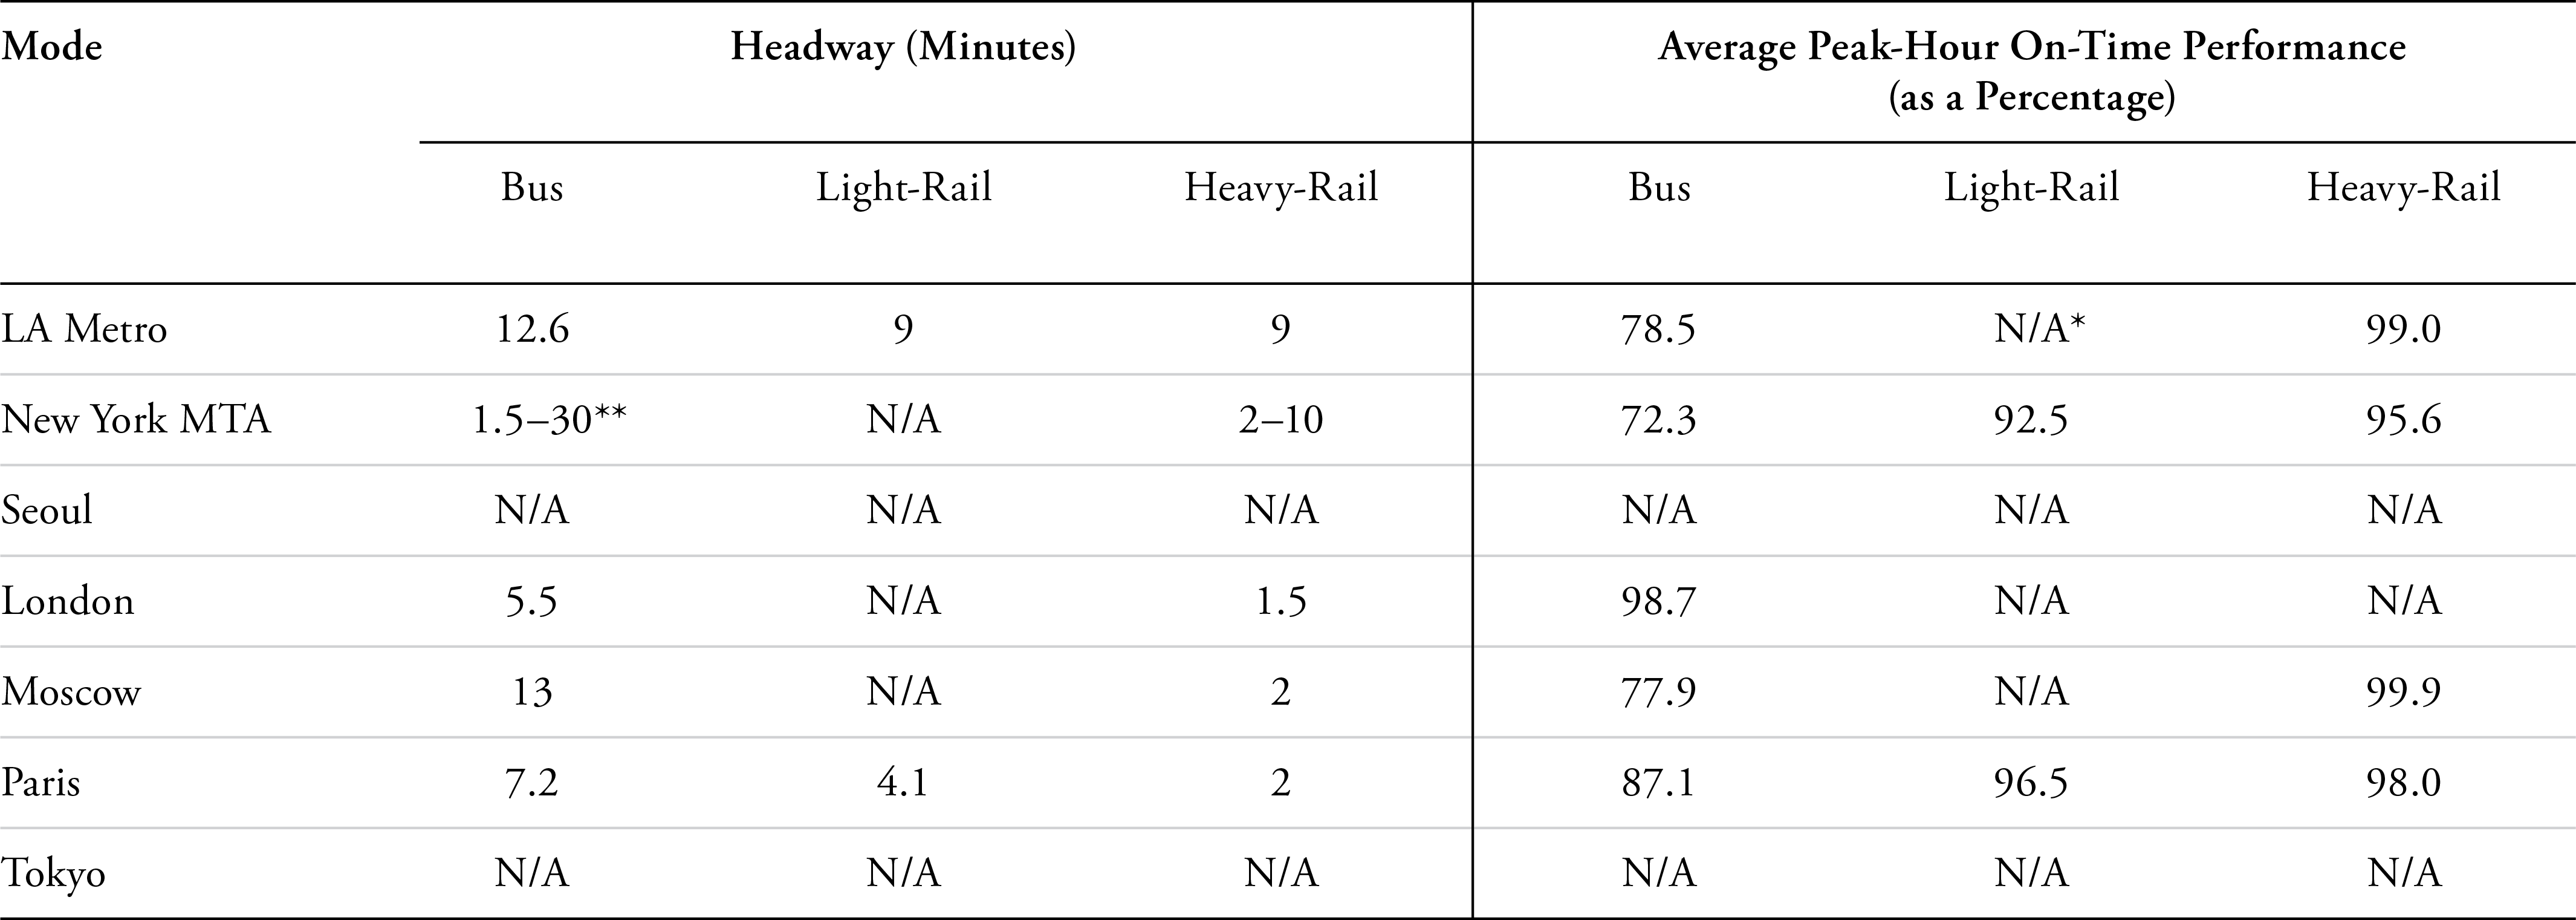
Source: Column 2 from “Average Headway During Peak Times,” CityTransitData. Column 3 from “Schedule Compliance/Punctuality,” CityTransitData.
Additionally, LA Metro workers are highly unionized. Their average pay (including benefits) is around $38–40 per hour for transit operators. Compared to other non-college jobs in the area like heavy truck drivers ($29.08 per hour) or construction laborers ($31.80 per hour), the higher union wages pull ahead by a fair margin.[68]
E. Service Reliability
The key concerns for any commuter or passenger trying to get from point A to point B are the time it will take to do so and the trip’s daily variability. These inform the travel decisions of millions of Americans daily.
Two performance metrics are key when assessing reliability: headway (the time between two buses arriving at a bus stop, or between two metro trains arriving at a station) and on-time performance.
CityTransitData tracks on-time performance (labeled as schedule compliance) for bus and metro, as well as headways for all of LA Metro’s transit services.[69]
Short headways equal frequent service and long headways infrequent service. As shown in Table 8, LA Metro’s buses have an average headway similar to that of other cities, but their on-time reliability lags behind cities such as London and Paris. LA Metro’s buses are late 21.5 percent of the time, likely due to the city’s traffic.[70] On the other hand, LA Metro’s rail systems have headways two to four times longer than other cities’ systems, but are equally or more reliable. One of the reasons LA Metro is more reliable is that the system operates fewer trains per track than the system can handle, thus offering a buffer when a large number of passengers are entering or exiting trains or if there’s a breakdown. But riders do not prefer this trade-off. Most transit riders would give up a little punctuality for more frequent service, according to surveys.[71]
The Best “Go Paid” Deal on Substack! You Get REAL Stuff!!

Go paid at the $5 a month level, and we will send you both the PDF and e-Pub versions of Etienne’s new book: To See the Cage Is to Leave It - 25 Techniques the Few Use to Control the Many and a coupon code for 10% off anything in the https://artofliberty.org/store/.
Go paid at the $50 a year level, and we will send you a free paperback edition of Etienne’s new book: To See the Cage Is to Leave It - 25 Techniques the Few Use to Control the Many OR “Government” - The Biggest Scam in History… Exposed! OR a 64GB Liberator flash drive if you live in the US. If you are international, we will give you a $10 credit towards shipping if you agree to pay the remainder.
Support us at the $250 Founding Member Level and get a signed high-resolution hardcover of “Government” - The Biggest Scam in History... Exposed! + Liberator flash drive + a signed high-resolution hardcover of Etienne’s new book: To See the Cage Is to Leave It - 25 Techniques the Few Use to Control the Many + everything else in our “Everything Bundle” of the best in voluntaryist thought delivered domestically. International pays shipping. Our only option for signed copies besides catching Etienne @ an event.


