

Abstract
Summary
There is increasing concern that most current published research findings are false. The probability that a research claim is true may depend on study power and bias, the number of other studies on the same question, and, importantly, the ratio of true to no relationships among the relationships probed in each scientific field. In this framework, a research finding is less likely to be true when the studies conducted in a field are smaller; when effect sizes are smaller; when there is a greater number and lesser preselection of tested relationships; where there is greater flexibility in designs, definitions, outcomes, and analytical modes; when there is greater financial and other interest and prejudice; and when more teams are involved in a scientific field in chase of statistical significance. Simulations show that for most study designs and settings, it is more likely for a research claim to be false than true. Moreover, for many current scientific fields, claimed research findings may often be simply accurate measures of the prevailing bias. In this essay, I discuss the implications of these problems for the conduct and interpretation of research.
Figures
Published research findings are sometimes refuted by subsequent evidence, with ensuing confusion and disappointment. Refutation and controversy is seen across the range of research designs, from clinical trials and traditional epidemiological studies [1–3] to the most modern molecular research [4,5]. There is increasing concern that in modern research, false findings may be the majority or even the vast majority of published research claims [6–8]. However, this should not be surprising. It can be proven that most claimed research findings are false. Here I will examine the key factors that influence this problem and some corollaries thereof.
Modeling the Framework for False Positive Findings
Several methodologists have pointed out [9–11] that the high rate of nonreplication (lack of confirmation) of research discoveries is a consequence of the convenient, yet ill-founded strategy of claiming conclusive research findings solely on the basis of a single study assessed by formal statistical significance, typically for a p-value less than 0.05. Research is not most appropriately represented and summarized by p-values, but, unfortunately, there is a widespread notion that medical research articles should be interpreted based only on p-values. Research findings are defined here as any relationship reaching formal statistical significance, e.g., effective interventions, informative predictors, risk factors, or associations. “Negative” research is also very useful. “Negative” is actually a misnomer, and the misinterpretation is widespread. However, here we will target relationships that investigators claim exist, rather than null findings.
It can be proven that most claimed research findings are false
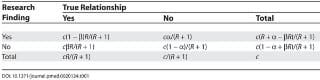
As has been shown previously, the probability that a research finding is indeed true depends on the prior probability of it being true (before doing the study), the statistical power of the study, and the level of statistical significance [10,11]. Consider a 2 × 2 table in which research findings are compared against the gold standard of true relationships in a scientific field. In a research field both true and false hypotheses can be made about the presence of relationships. Let R be the ratio of the number of “true relationships” to “no relationships” among those tested in the field. R is characteristic of the field and can vary a lot depending on whether the field targets highly likely relationships or searches for only one or a few true relationships among thousands and millions of hypotheses that may be postulated. Let us also consider, for computational simplicity, circumscribed fields where either there is only one true relationship (among many that can be hypothesized) or the power is similar to find any of the several existing true relationships. The pre-study probability of a relationship being true is R/(R + 1). The probability of a study finding a true relationship reflects the power 1 - β (one minus the Type II error rate). The probability of claiming a relationship when none truly exists reflects the Type I error rate, α. Assuming that c relationships are being probed in the field, the expected values of the 2 × 2 table are given in Table 1. After a research finding has been claimed based on achieving formal statistical significance, the post-study probability that it is true is the positive predictive value, PPV. The PPV is also the complementary probability of what Wacholder et al. have called the false positive report probability [10]. According to the 2 × 2 table, one gets PPV = (1 - β)R/(R - βR + α). A research finding is thus more likely true than false if (1 - β)R > α. Since usually the vast majority of investigators depend on a = 0.05, this means that a research finding is more likely true than false if (1 - β)R > 0.05.
What is less well appreciated is that bias and the extent of repeated independent testing by different teams of investigators around the globe may further distort this picture and may lead to even smaller probabilities of the research findings being indeed true. We will try to model these two factors in the context of similar 2 × 2 tables.
Bias
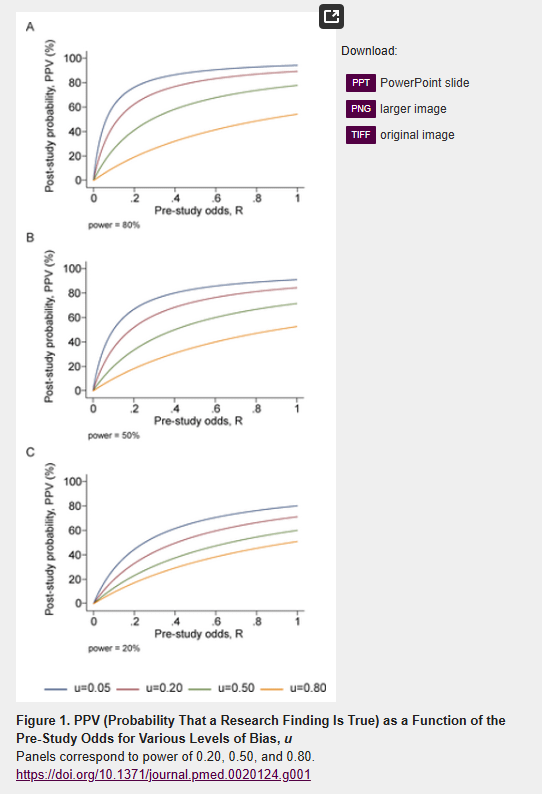
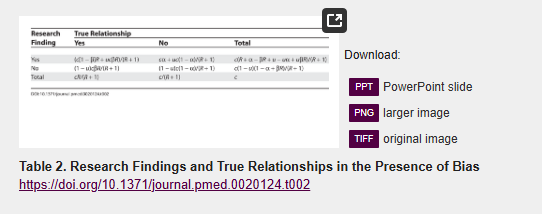
First, let us define bias as the combination of various design, data, analysis, and presentation factors that tend to produce research findings when they should not be produced. Let u be the proportion of probed analyses that would not have been “research findings,” but nevertheless end up presented and reported as such, because of bias. Bias should not be confused with chance variability that causes some findings to be false by chance even though the study design, data, analysis, and presentation are perfect. Bias can entail manipulation in the analysis or reporting of findings. Selective or distorted reporting is a typical form of such bias. We may assume that u does not depend on whether a true relationship exists or not. This is not an unreasonable assumption, since typically it is impossible to know which relationships are indeed true. In the presence of bias (Table 2), one gets PPV = ([1 - β]R + uβR)/(R + α − βR + u − uα + uβR), and PPV decreases with increasing u, unless 1 − β ≤ α, i.e., 1 − β ≤ 0.05 for most situations. Thus, with increasing bias, the chances that a research finding is true diminish considerably. This is shown for different levels of power and for different pre-study odds in Figure 1. Conversely, true research findings may occasionally be annulled because of reverse bias. For example, with large measurement errors relationships are lost in noise [12], or investigators use data inefficiently or fail to notice statistically significant relationships, or there may be conflicts of interest that tend to “bury” significant findings [13]. There is no good large-scale empirical evidence on how frequently such reverse bias may occur across diverse research fields. However, it is probably fair to say that reverse bias is not as common. Moreover measurement errors and inefficient use of data are probably becoming less frequent problems, since measurement error has decreased with technological advances in the molecular era and investigators are becoming increasingly sophisticated about their data. Regardless, reverse bias may be modeled in the same way as bias above. Also reverse bias should not be confused with chance variability that may lead to missing a true relationship because of chance.
Testing by Several Independent Teams
Several independent teams may be addressing the same sets of research questions. As research efforts are globalized, it is practically the rule that several research teams, often dozens of them, may probe the same or similar questions. Unfortunately, in some areas, the prevailing mentality until now has been to focus on isolated discoveries by single teams and interpret research experiments in isolation. An increasing number of questions have at least one study claiming a research finding, and this receives unilateral attention. The probability that at least one study, among several done on the same question, claims a statistically significant research finding is easy to estimate. For n independent studies of equal power, the 2 × 2 table is shown in Table 3: PPV = R(1 − βn)/(R + 1 − [1 − α]n − Rβn) (not considering bias). With increasing number of independent studies, PPV tends to decrease, unless 1 - β < a, i.e., typically 1 − β < 0.05. This is shown for different levels of power and for different pre-study odds in Figure 2. For n studies of different power, the term βn is replaced by the product of the terms βi for i = 1 to n, but inferences are similar.

Want to give some gifts that will be remembered for years to come and help your friends, family and colleagues better understand the scam of “Government?”
Happy Holidays from the Art of Liberty Foundation! Get 10% off from December 18th until Christmas using the discount code: Liberty10!
Shop for unique books and gifts now at ArtOfLiberty.org/Store


